
S&P 500
Dow Jones
Nasdaq
10-Year US Treasury Yield
British Pound per USD
Euro per USD
USD per Yen
Swiss franc per EUR
U.S. News
ISM Services
- ISM Services PMI held in expansion at 54.0 in June vs. 54.5 in May, slightly below the 54.3 consensus.
- The prices index fell to 67.7, its first sub-70 reading since February, though respondents flagged tariffs as a continued source of upward pricing pressure alongside energy/petroleum costs.
- The employment index expanded for the first time in four months, even as new orders grew at a slightly slower pace — a mixed but stabilizing demand picture heading into H2.
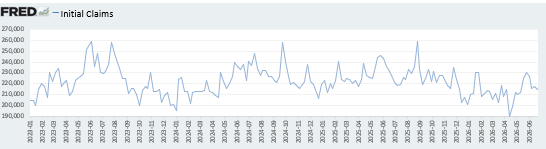
Initial Jobless Claims
- Initial jobless claims edged down to 215,000 in the week through July 4 (from an upwardly revised 217,000), below the 218,000 expected, reinforcing the labor market's "low hire, low fire" posture.
- Continuing claims rose 8,000 to 1.81M in the week through June 27, a modest uptick pointing to a labor market that has cooled but remains steady.
- The Conference Board's June job-market reading slipped slightly on consumer pessimism about hiring, though nonfarm payroll levels remain elevated.
Minutes of Fed's June FOMC Meeting
- Fed on hold at 3.50–3.75% but leaning hawkish — minutes from Warsh's first meeting as Chair show officials broadly agreed rates must rise if inflation stays elevated.
- AI build-out emerged as a new inflation risk, with more officials flagging the surge in AI/data-center investment — alongside tariffs and Middle East-driven energy costs.
- Warsh is deliberately keeping the Fed's tactics ambiguous — he dismissed complaints that markets need clearer guidance, pointing to falling rate volatility, lower Treasury yields, and easing inflation expectations after June as evidence his approach is working.
Jobless Claims
- Initial jobless claims, a measure of how many workers were laid off across the U.S., decreased to 215,000 in the week ended July 3, down 2,000 from the prior week.
- The four-week moving average was 218,750, down 3,750 from the prior week.
- Continuing claims — those filed by workers unemployed for longer than a week — increased at 1.814 million in the week ended June 26. This figure is reported with a one-week lag.
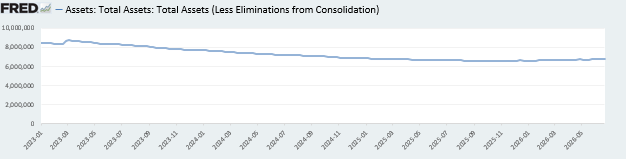
Fed's Balance Sheet
- The Federal Reserve's assets totaled $6.736 trillion in the week ended July 10, up $11.0 billion from the prior week.
- Treasury holdings totaled $4.500 trillion, up $7.8 billion from the prior week.
- Holdings of mortgage-backed securities (MBS) were $1.95 trillion in the week, down $15.0 billion from the prior week.
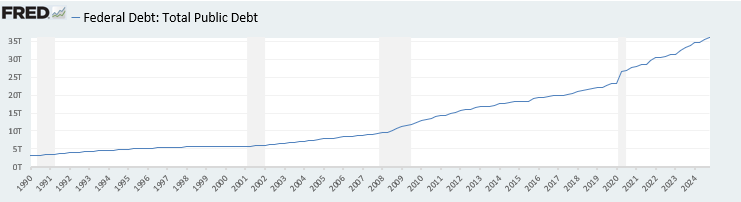
Total Public Debt
- Total public debt outstanding was $39.41 trillion as of July 10, an increase of 7.7% from the previous year.
- Debt held by the public was $31.71 trillion, and intragovernmental holdings were $7.78 trillion.
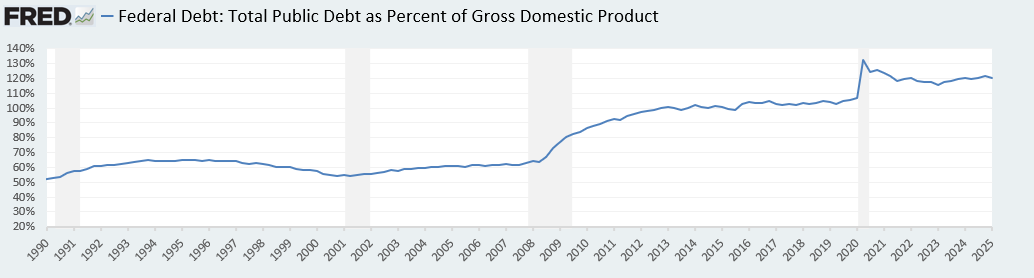
GDP
- The latest annualized U.S. GDP stands at $31.87 trillion as of March 31, 2026, an increase of 1.41% from the previous quarter, & an increase of 6.07% from the previous year.
- The total public debt-to-GDP ratio is at 122.59% as of March 31, an increase of 2.05% from the previous year.
Inflation Factors
CPI:
- The consumer-price index rose 4.2% in May year over year.
- On a monthly basis, the CPI increased 0.5% in May on a seasonally adjusted basis, after increasing 0.6% in April.
- The index for all items less food and energy (core CPI) rose 0.2% in May, after rising 0.4% in April.
- Core CPI increased 2.9% for the 12 months ending May.
Food & Beverages:
- The food at home index increased 2.7% in May from the same month a year earlier, and increased 0.1% in May month over month.
- The food away from home index increased 3.5% in May from the same month a year earlier, and increased 0.3% in May month over month.
Commodities:
- The energy commodities index increased 6.7% in May after increasing 5.6% in April.
- The energy commodities index rose 40.6% over the last 12 months.
- The energy services index rose 0.7% in May after increasing 0.9% in April.
- The energy services index rose 5.3% over the last 12 months.
- The gasoline index rose 40.5% over the last 12 months.
- The fuel oil index rose 58.9% over the last 12 months.
- The index for electricity rose 5.9% over the last 12 months.
- The index for natural gas rose 3.0% over the last 12 months.
Supply Chain:
- Drewry's composite World Container Index increased to $4,638.59 per 40ft container for the week of July 10.
- Drewry's composite World Container Index has increased by 73.6% over the last 12 months.
Housing Market:
- The shelter index increased 0.3% in May after increasing 0.6% in April.
- The rent index increased 0.3% in May after increasing 0.6% in April.
- The index for lodging away from home increased 2.6% in May after increasing 4.0% in April.
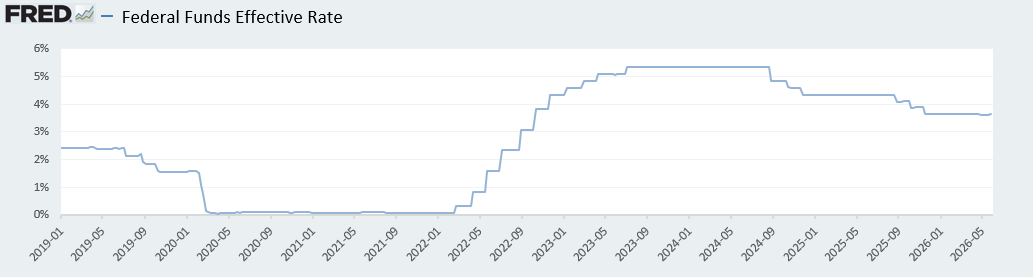
Federal Funds Rate
- The effective Federal Funds Rate is at 3.62%, down (0.02%) year to date.
Money Market Funds
- Money market fund assets stood at $7.95 trillion as of July 8, 2026, up 0.1% from the previous week, & up 12.4% from the previous year.

World News
Middle East
- Hormuz traffic remains badly choked three weeks after Trump signed the interim MOU at Versailles — daily crossings fell to just 25 on Wednesday (from 49 the prior day) versus 100+ per day pre-war — as a dispute over Paragraph 5's deliberately vague wording has erupted into two rounds of U.S.-Iran strikes in two weeks.
- The U.S. Navy has been quietly shepherding vessels through a southern corridor hugging Omani waters, helping Persian Gulf crude exports rebound to more than half pre-war levels with Qatari LNG a key beneficiary.
- Iraq agreed to new controls blocking dollars from reaching Iran and its militias in exchange for the U.S. restarting shipments of American banknotes to Baghdad, suspended for four months since the Iran war began — a halt that had cut off badly needed cash from oil sales held at the New York Fed and pressured Baghdad to curtail its ties to Tehran.
- The Fed had shipped up to $13B/year in banknotes to Iraq's cash-based economy, giving Washington rare leverage to push Baghdad toward disarming the militias and cutting Tehran's financial tentacles.
Europe
- UniCredit lifted its Commerzbank stake to 47.6% (49.65% of voting rights) via a tender offer, giving it de facto control of shareholder meetings and putting it just one step from control of the bank, though a full takeover still needs ECB approval — a process that could take up to six months and most realistically wouldn't close until spring 2027, in a deal now valuing Commerzbank at roughly €41.9 billion.
- Only ~2% of independent shareholders tendered, which Commerzbank called clear evidence of the offer's low attractiveness, underscoring stiff resistance from both bank management — which argues the price is too low — and the German government, still a ~13% shareholder after its 2008 crisis-era bailout, in what would be Europe's biggest bank merger since the ill-fated ABN Amro takeover in 2007.
- Trump's threats to annex Greenland and Canada triggered emergency EU summits — one so charged leaders dubbed it "therapy night" — and what Carney calls a transatlantic "rupture," splitting allies between Rutte's flattery diplomacy (pledging 5% of GDP on defense and continued U.S. arms buys) and Carney's push for European/Canadian defense and tech independence.
- Europe and Canada are quietly cutting reliance on U.S. tech, software, and military systems — putting their own satellites into space to avoid Elon Musk's Starlink and building AI and quantum-computing platforms outside American control — after Carney commissioned a review of Canada's dependence on the U.S. for data storage, military hardware, payments, and even food, with leaders increasingly treating strategic autonomy as a permanent necessity rather than a temporary hedge, regardless of who holds the White House.
China
- China's PPI accelerated to +4.1% y/y in June (from +3.9% in May), a fourth straight monthly gain unwinding a 41-month deflationary streak, though the rise was largely a Middle East oil/commodity effect now fading.
- CPI cooled to +1.0% y/y (below the 1.2% expected) with core also at 1.0%, signaling persistent weak domestic demand and lingering disinflation as trade-in stimulus fades; markets now await the end-of-month Politburo meeting for demand-support measures.
- Chinese EV makers like BYD have solved the engineering and price problem, but not the trust problem — Finnish buyers question whether the cars spy on them, have "kill switches," or funnel money to the CCP.
- To sidestep EU tariffs (in place since 2024), BYD is building inside the bloc via a new Hungary plant targeting tariff-exempt cars by year-end.
Geopolitical Hotspots
Venezuela
- Twin magnitude 7+ earthquakes struck Venezuela on June 25-26, killing 900+ and leaving 51,000 missing — citizens conducted their own rescue operations amid a slow government response, putting Rodríguez's leadership under its first major test and casting uncertainty over the Trump administration's partnership with her and the prospect of US investment reopening in the country
Colombia
- Far-right populist Abelardo de la Espriella — a criminal defense attorney who has represented paramilitary commanders and money launderers — captured 44% of the vote in Colombia's first-round presidential election, setting up a June 21 runoff against leftist Iván Cepeda that presents voters with the starkest ideological choice in the country's modern political history
India
- Google's $15 billion AI data center hub in water-stressed Visakhapatnam, India — backed by $2.3 billion in state subsidies and partnerships with Adani and Bharti Airtel — highlights the intensifying geopolitical race to anchor U.S. AI infrastructure in high-growth emerging markets, even as local displacement and resource competition spark growing backlash that could complicate future build-outs across the developing world
Africa
- The WHO declared a global health emergency over an Ebola outbreak in Congo and Uganda, with around 80 deaths and over 200 suspected cases recorded — including cases in both countries' capitals — involving the rare Bundibugyo strain for which no approved vaccine or treatment currently exists
Cuba
- CIA Director Ratcliffe made a rare visit to Havana to warn Cuban officials they have a limited window to engage with the Trump administration, as the island faces severe fuel shortages, widespread blackouts, and growing street protests
Australia
- Australia is permanently diversifying its oil imports beyond Middle East suppliers and accelerating its renewable energy transition, even as it secures emergency fuel reserves to buffer against the ongoing Strait of Hormuz disruption
Canada
- Canada approved Enbridge's ~$3 billion Westcoast pipeline expansion, adding 300 million cubic feet per day of capacity as part of PM Carney's push to reduce U.S. trade dependence and boost Asian energy exports
Italy
- Trump publicly broke with Italian PM Giorgia Meloni — once his closest European ally — after she refused to send forces to the Strait of Hormuz and called his attacks on Pope Leo "unacceptable," leaving her isolated on both sides of the Atlantic
Japan
- Japan will release an additional 20 days' worth of oil reserves in early May to stabilize energy prices, as the country relies on the Middle East for over 90% of its crude imports and the Strait of Hormuz remains largely blocked
New Zealand
- New Zealand plans to spend roughly $7 billion on its military, including enhanced strike capabilities and new helicopters, aiming to reverse military attrition by recruiting 2,500 personnel in the coming years
Commodities News
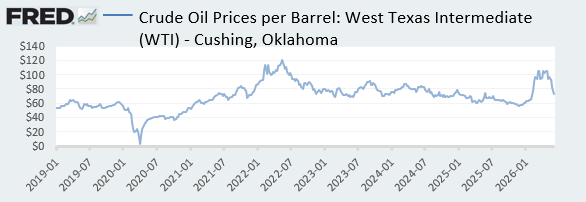
Oil Prices
- WTI: $71.51 per barrel
- +4.11% WoW; (4.55%) YTD; +4.58% YoY
- Brent: $75.95 per barrel
- +5.31% WoW; (3.31%) YTD; +10.65% YoY
US Production
- U.S. oil production amounted to 13.9 million bpd for the week ended July 3, up 0.0 million bpd from the prior week.
Rig Count
- The total number of oil rigs amounted to 581, up 1 from last week.
Inventories
Crude Oil
- Total U.S. crude oil inventories now amount to 411.4 million barrels, down (3.4%) YoY.
- Refiners operated at a capacity utilization rate of 95.8% for the week, down from 96.6% in the prior week.
- U.S. crude oil imports now amount to 5.279 million barrels per day, down (6.4%) YoY.
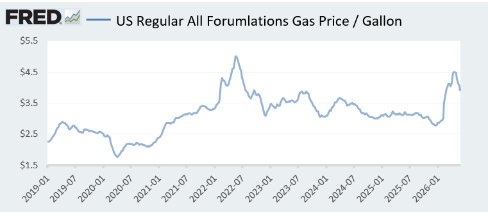
Gasoline
- Retail average regular gasoline prices amounted to $3.88 per gallon in the week of July 10, up 22.6% YoY.
- Gasoline prices on the East Coast amounted to $3.82, up 21.9% YoY.
- Gasoline prices in the Midwest amounted to $3.62, up 18.2% YoY.
- Gasoline prices on the Gulf Coast amounted to $3.45, up 23.8% YoY.
- Gasoline prices in the Rocky Mountain region amounted to $3.79, up 16.3% YoY.
- Gasoline prices on the West Coast amounted to $4.96, up 18.0% YoY.
- Motor gasoline inventories were down by 1.9 million barrels from the prior week.
- Motor gasoline inventories amounted to 212.1 million barrels, down (7.6%) YoY.
- Production of motor gasoline averaged 9.74 million bpd, down (1.6%) YoY.
- Demand for motor gasoline amounted to 8.845 million bpd, down (3.4%) YoY.
Distillates
- Distillate inventories decreased by 5.0 million in the week of July 10.
- Total distillate inventories amounted to 103.6 million barrels, up 0.8% YoY.
- Distillate production averaged 5.187 million bpd, up 1.8% YoY.
- Demand for distillates averaged 4.307 million bpd in the week, up 17.4% YoY.
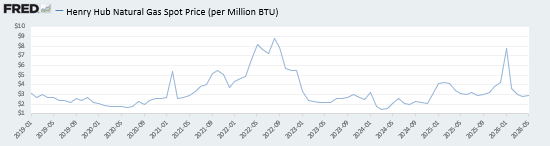
Natural Gas
- Natural gas inventories increased by 61 billion cubic feet last week.
- Total natural gas inventories now amount to 2,983 billion cubic feet, down (0.8%) YoY.
Credit News
High-yield:
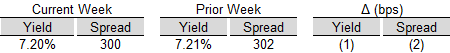
High yield bond yields decreased 1bps to 7.20% and spreads tightened 2bps to 300bps. Leveraged loan yields decreased 4bps to 8.92% and spreads tightened 6bps to 493bps. WTD high yield bond returns were positive 17bps. WTD leveraged loan returns were positive 32bps. 10yr treasury yields increased 7bps to 4.55%. High yield spreads tightened on resilient economic data and improving geopolitical sentiment despite higher treasury yields. Leveraged loan prices increased on active issuance, steady CLO inflows, and favorable macro data.
Week ended 07/10/2026
Yields & Spreads¹
Pricing & Returns¹

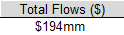
Fund Flows²
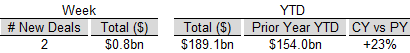
New Issue²
Distressed Level (trading in excess of 1,000 bps)²
Total HY Defaults

Leveraged loans:
Week ended 07/10/2026
Yields & Spreads¹
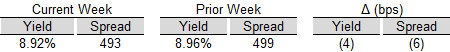
Pricing & Returns¹

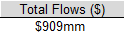
Fund Flows²
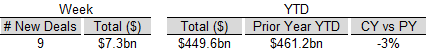
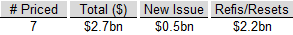
New Issue²
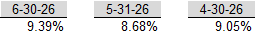
Distressed Level (loan price below $80)¹
Total Leveraged Loan Defaults

Default activity:
- Most recent defaults include: Dish DBS ($9.8bn, 6/30/2026), QVC Group ($2.2bn, 4/16/2026), Cumulus Media ($641mn, 03/05/2026), Trinseo ($390mn, 02/17/2026), Beasley Broadcasting Group ($189mn, 02/01/2026), Nine Energy Service ($300mn, 02/01/2026), Multi-Color ($4.5bn, 01/29/2026), Pretium Packaging ($201mn, 01/28/2026), Saks Global Enterprises ($2.7bn, 12/30/2025), and United Site Services ($2.6bn, 11/30/2025).
CLOs:
Week ended 07/10/2026
New U.S. CLO Issuance²
New U.S. CLO YTD Issuance²

Note: High-yield and leveraged loan yields and spreads are swap-adjusted
¹ Source: Credit Suisse High Yield and Leveraged Loan Index
² Source: JP Morgan
Ratings activity:
S&P and Moody's High Yield Ratings
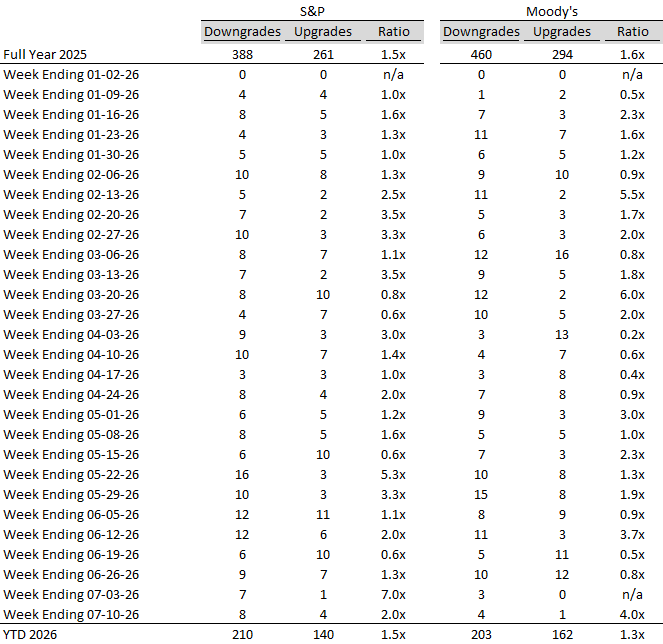
Source: Bloomberg
Appendix:
Diagram A: Leveraged Loan Trading Levels
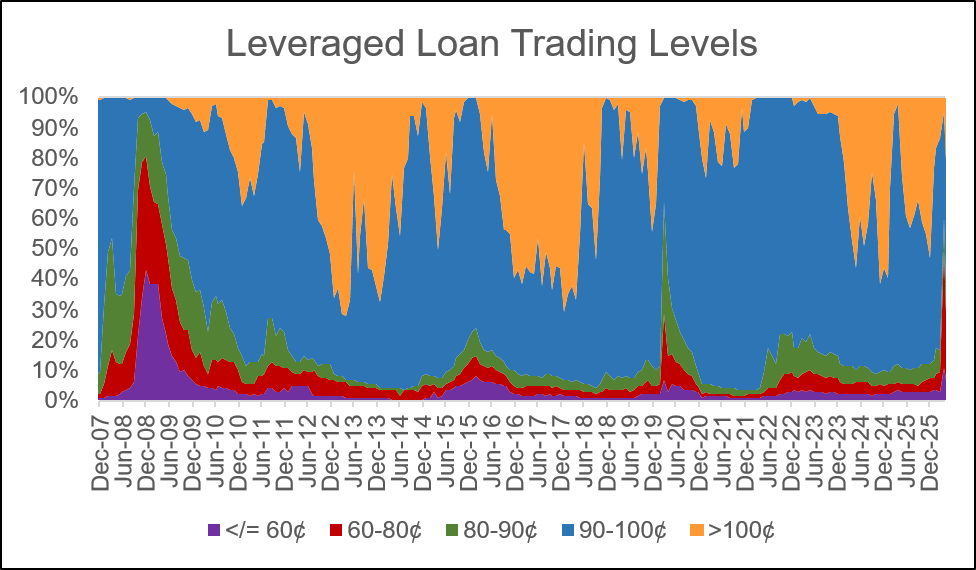
Source: Credit Suisse Leveraged Loan Index
Diagram B: High Yield and Leveraged Loan LTM Price
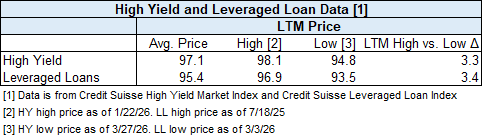
Diagram C: Leveraged Loan and High Yield Returns
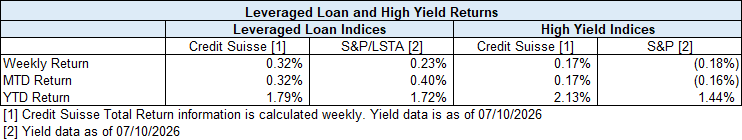
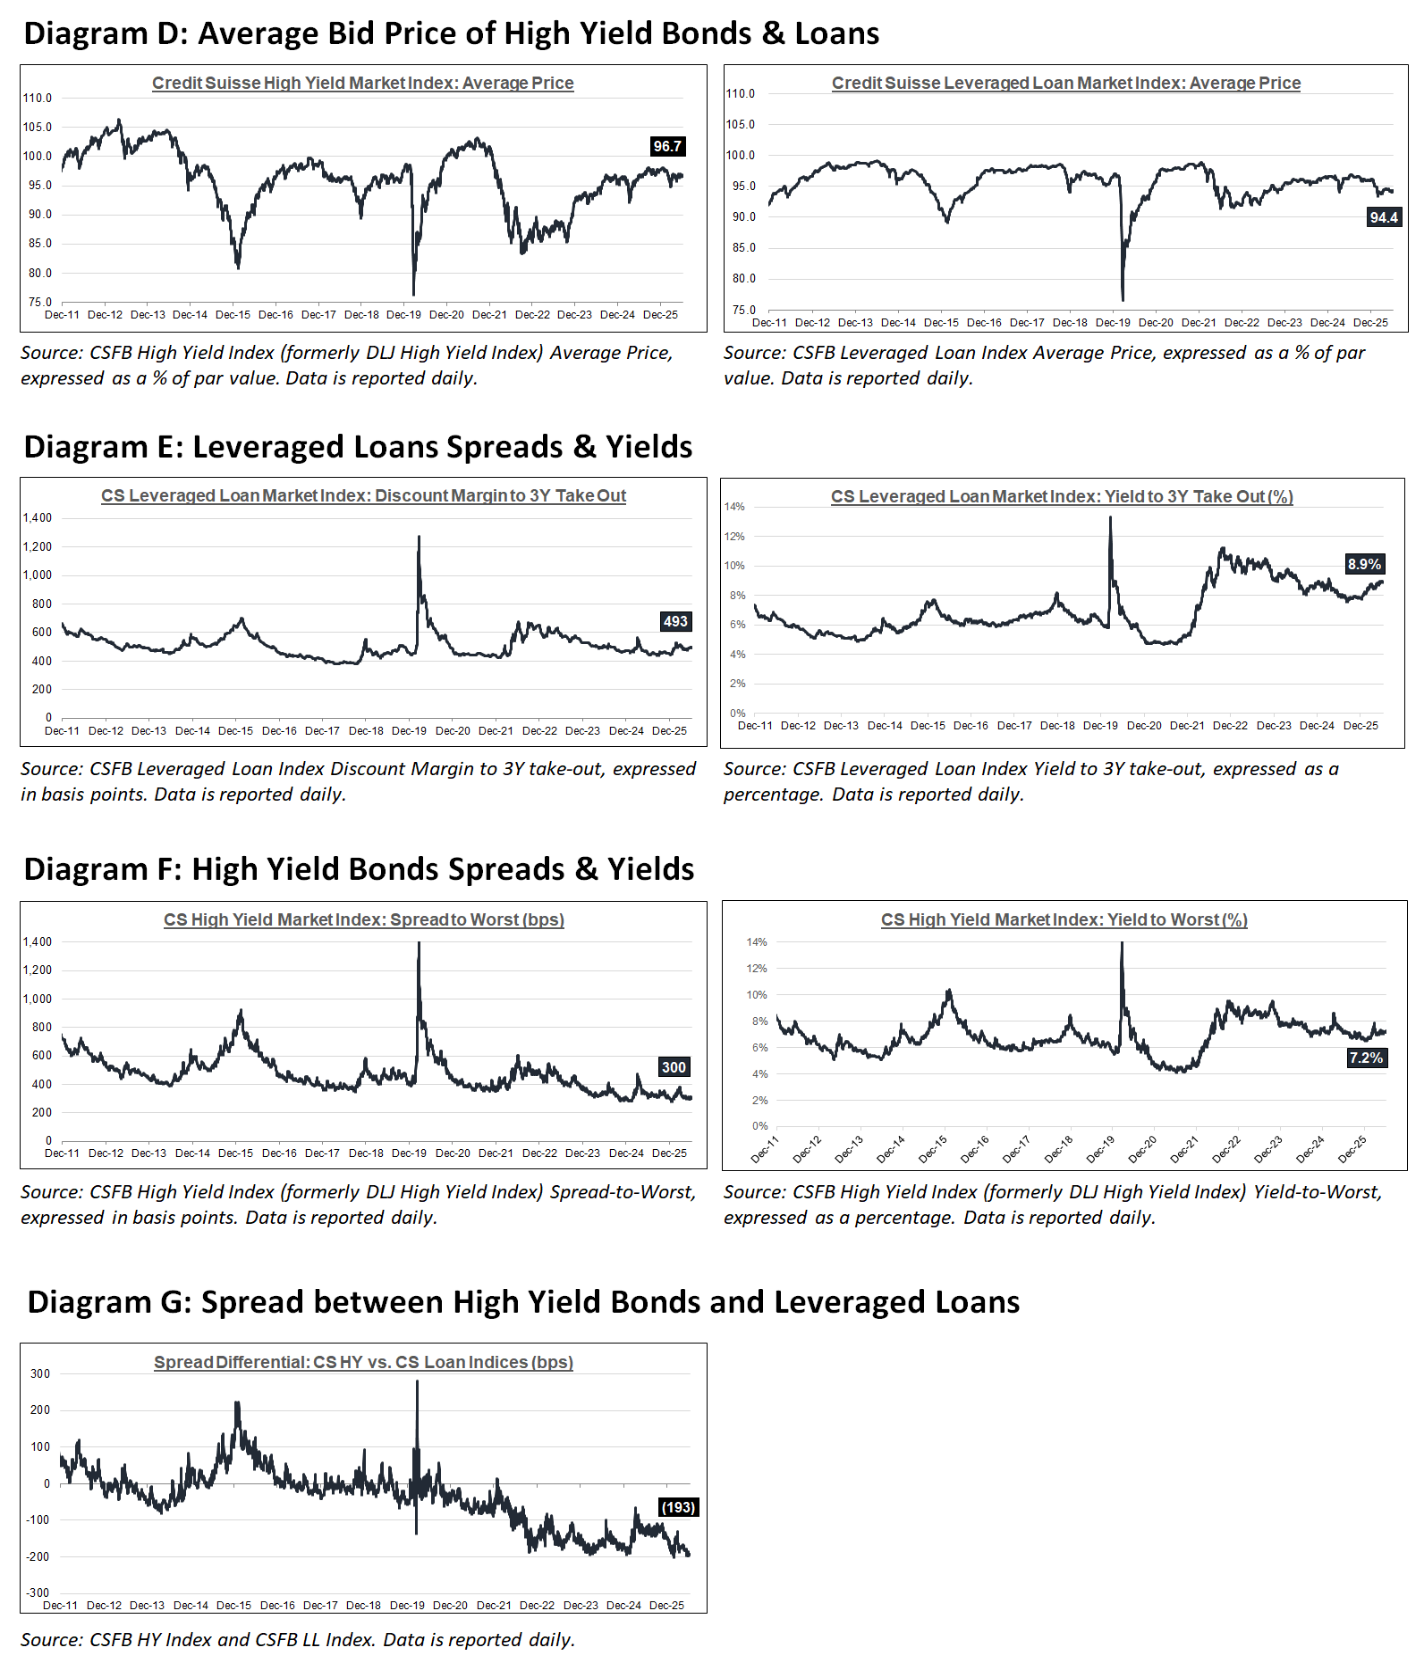
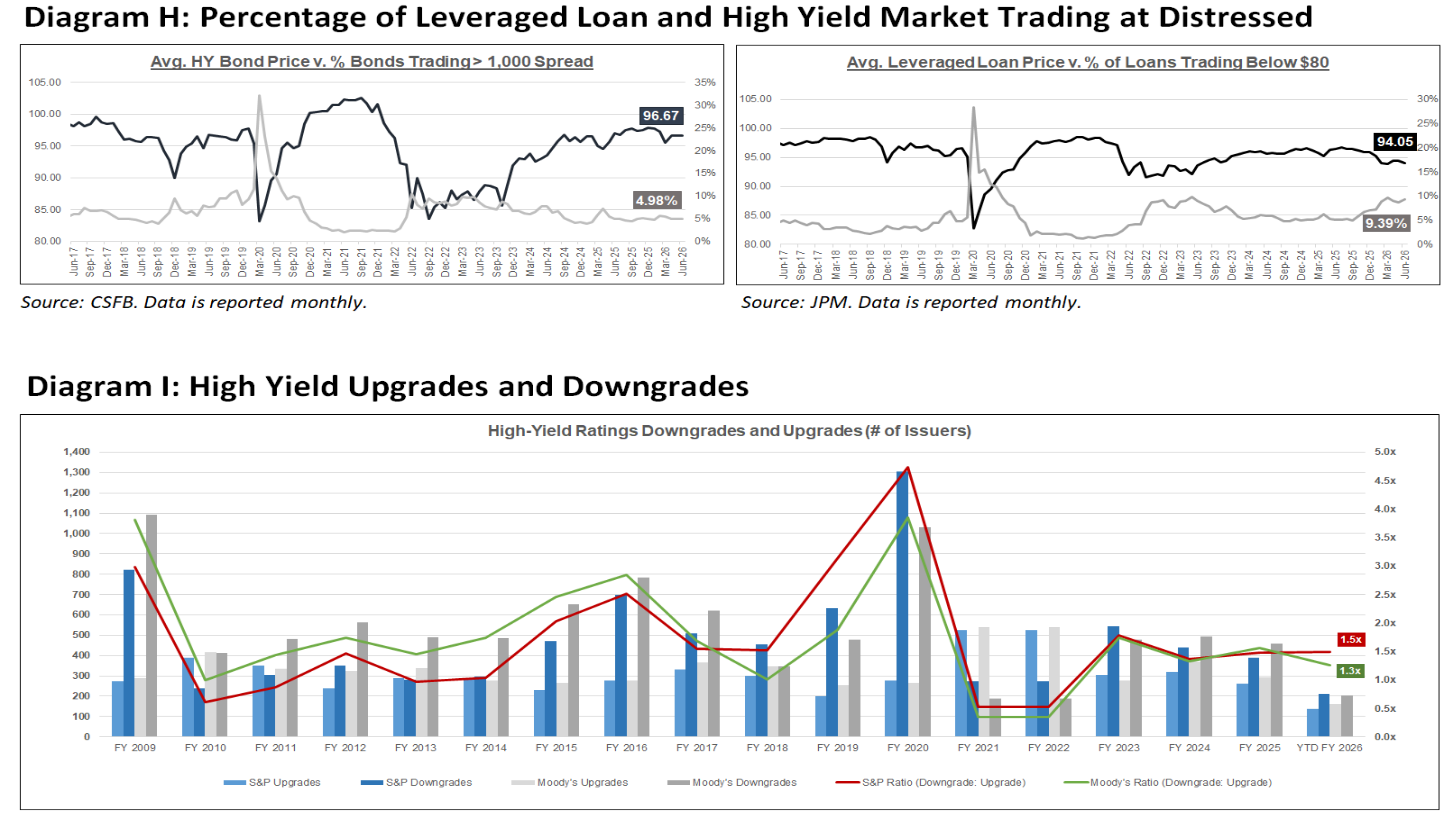
Diagram J: New Issue - Leveraged Loan and High Yield
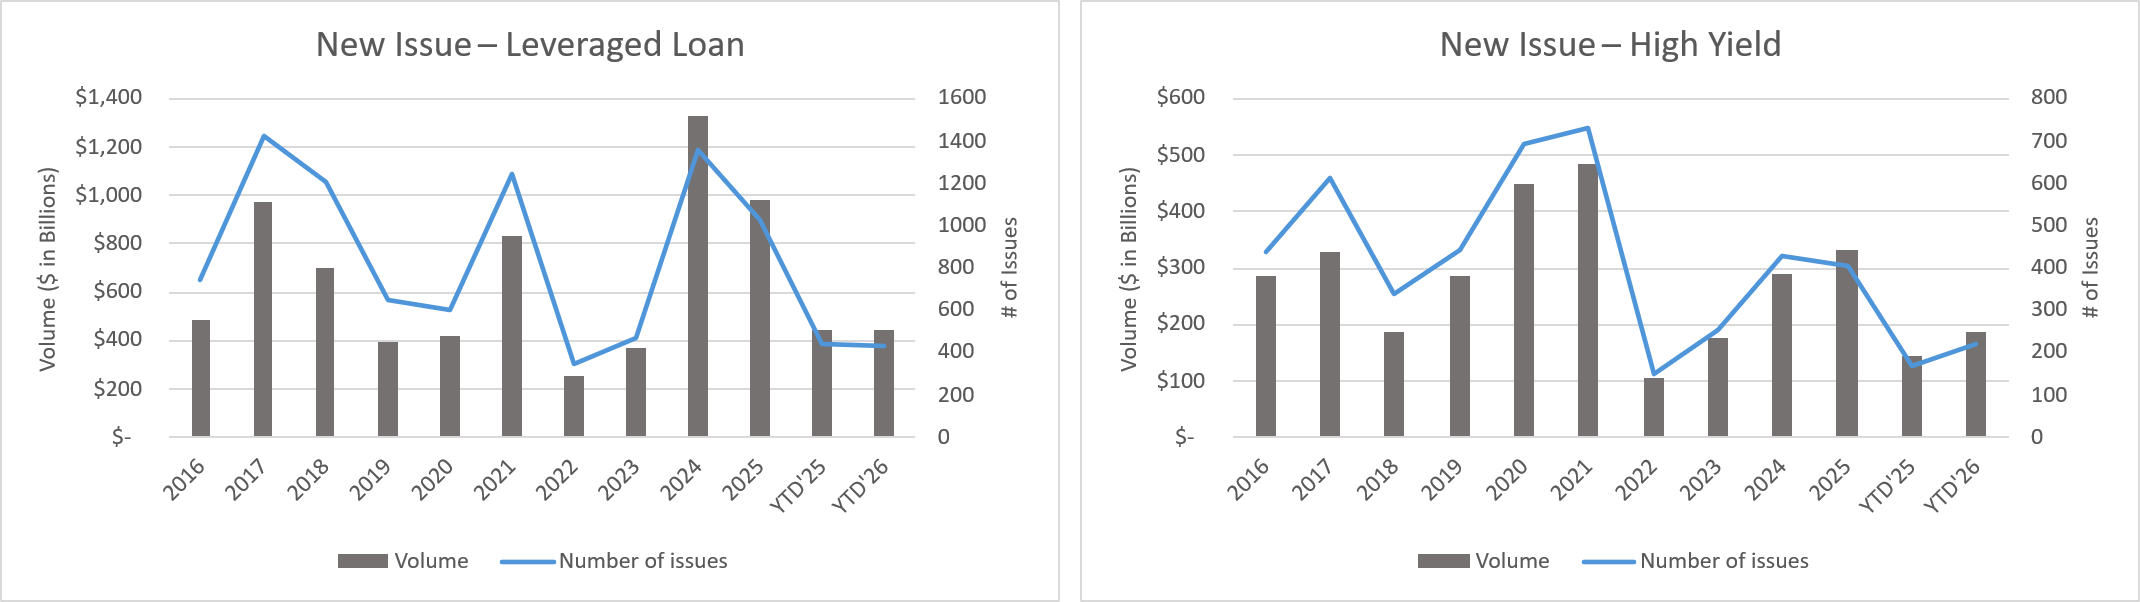
Diagram K: Leveraged Loan + HY Defaults by Sector – LTM

Source: JP Morgan Default Monitor
Diagram L: CLO Economics
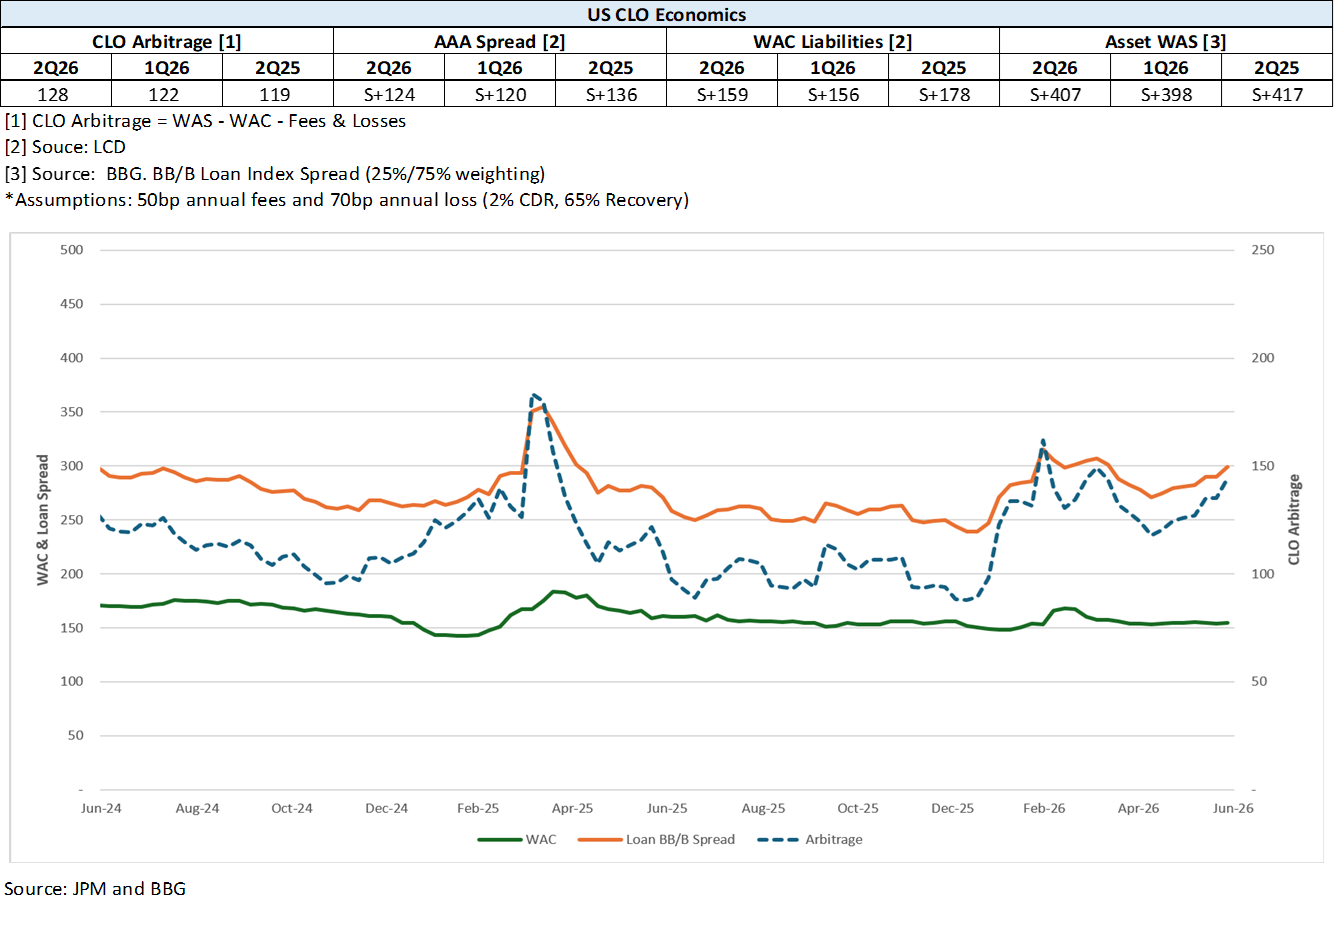
Diagram M: Developed Country Govt. Bond Yields (%)
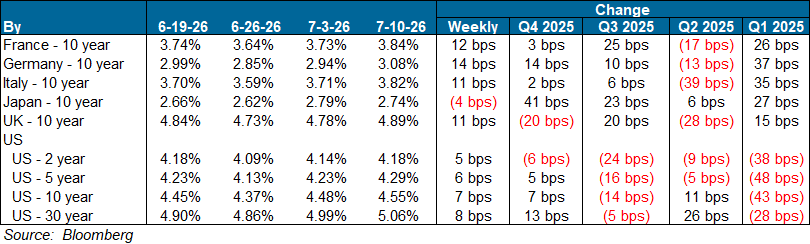
Diagram N: S&P 500 Historical Multiples

Source: S&P Capital IQ
Diagram O: U.S. Middle-Market M&A Valuations (EV/EBITDA)

Source: Pitchbook
Diagram P: U.S. Large Cap M&A Valuations (EV/EBITDA)

Source: Pitchbook
Diagram Q: Dry Powder for All Private Equity Buyouts ($B)
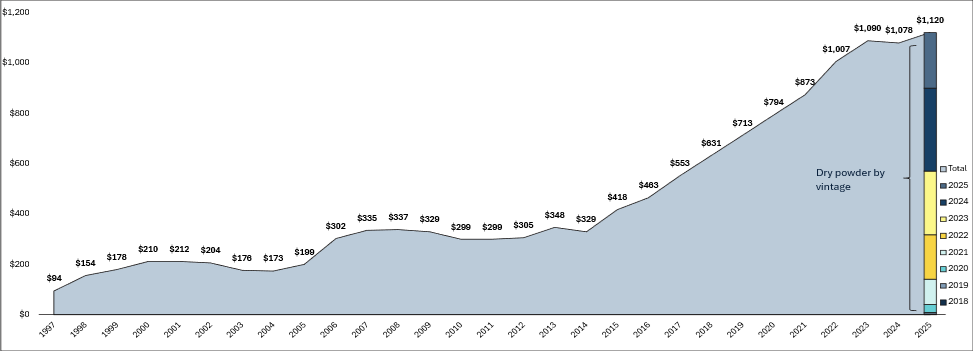
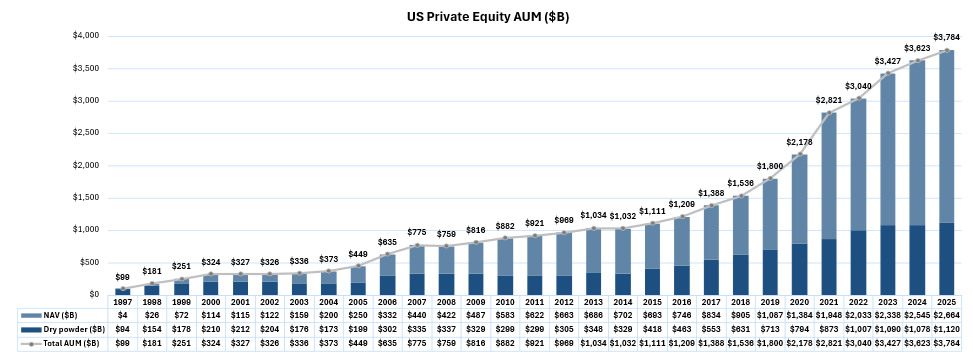

Diagram R: Dry Powder for All US Debt ($B)
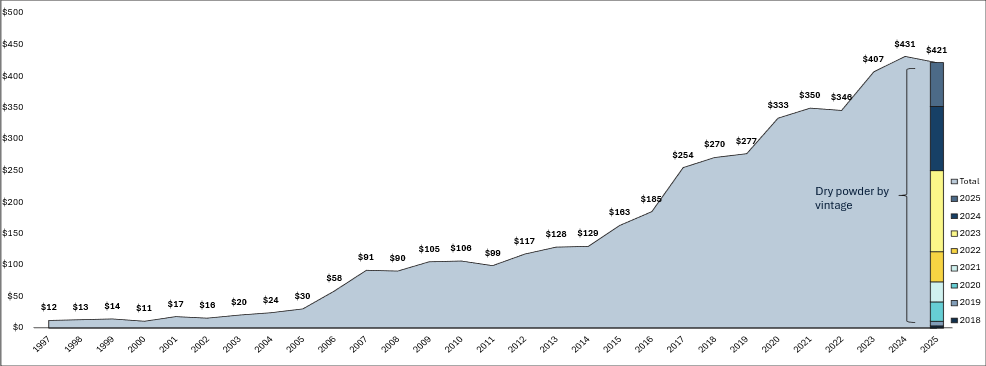
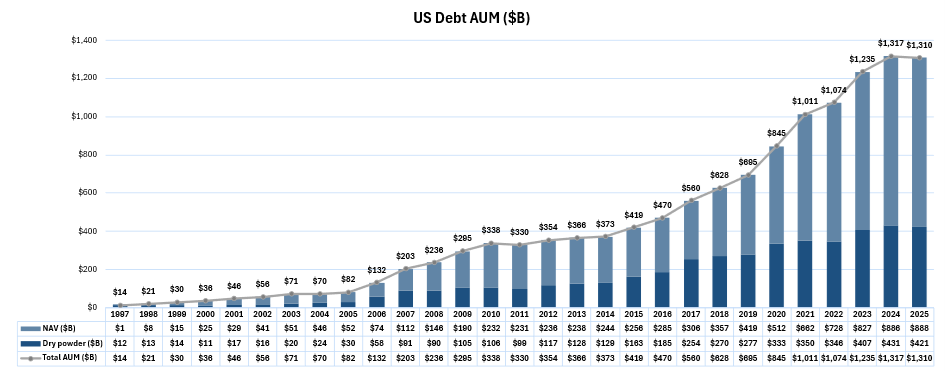

Diagram S: Structured Credit Spreads

Source: Bloomberg
Diagram T: Structured Credit Yield

Source: Bloomberg
Diagram U: SOFR Curve

Diagram V: CMBS Spreads

Source: Bloomberg