U.S. News
- PCE Index
- The PCE index rose 0.3% in February and 2.8% on an annualized basis
- PCE, excluding food and energy, also increased by 0.3% in February and 2.5% on an annualized basis
- Consumer spending increased 0.8% for February, higher than the 0.5% estimate
- Consumer Confidence
- Consumer confidence fell in March to a four-month low as persistent inflation and the 2024 presidential election made Americans more anxious
- Consumer confidence now stands at 104.7 in March, down from 106.7 in February
- American’s short-term expectations for the economy fell to 73.8 in February; a reading below 80 can signal a potential recession in the near future
- New Home Sales
- U.S. new home sales fell 0.3% to an annual rate of 662,000 in February. Economists had expected 675,000 in February
- New home sales fell sharply in the Northeast by 31.5% and in the Midwest by 2.4%
- The median sales price of a new home sold in February fell to $400,500 from $414,900 and the supply of new homes rose 1.2% in February
- Jobless Claims
- Initial jobless claims, a measure of how many workers were laid off across the U.S., decreased to 210,000 in the week ended March 22, down 2,000 from the prior week
- The four-week moving average was 211,000, down 750 from the prior week
- Continuing claims – those filed by workers unemployed for longer than a week – increased by 24,000 to 1.819 million in the week ended March 15. This figure is reported with a one-week lag
- Fed’s Balance Sheet
- The Federal Reserve’s assets totaled $7.485 trillion in the week ended March 29, down $29.6 billion from the prior week
- Treasury holdings totaled $4.619 trillion, down $3.1 billion from the prior week
- Holdings of mortgage-backed securities (MBS) were $2.40 trillion in the week, down $8.2 billion from the prior week
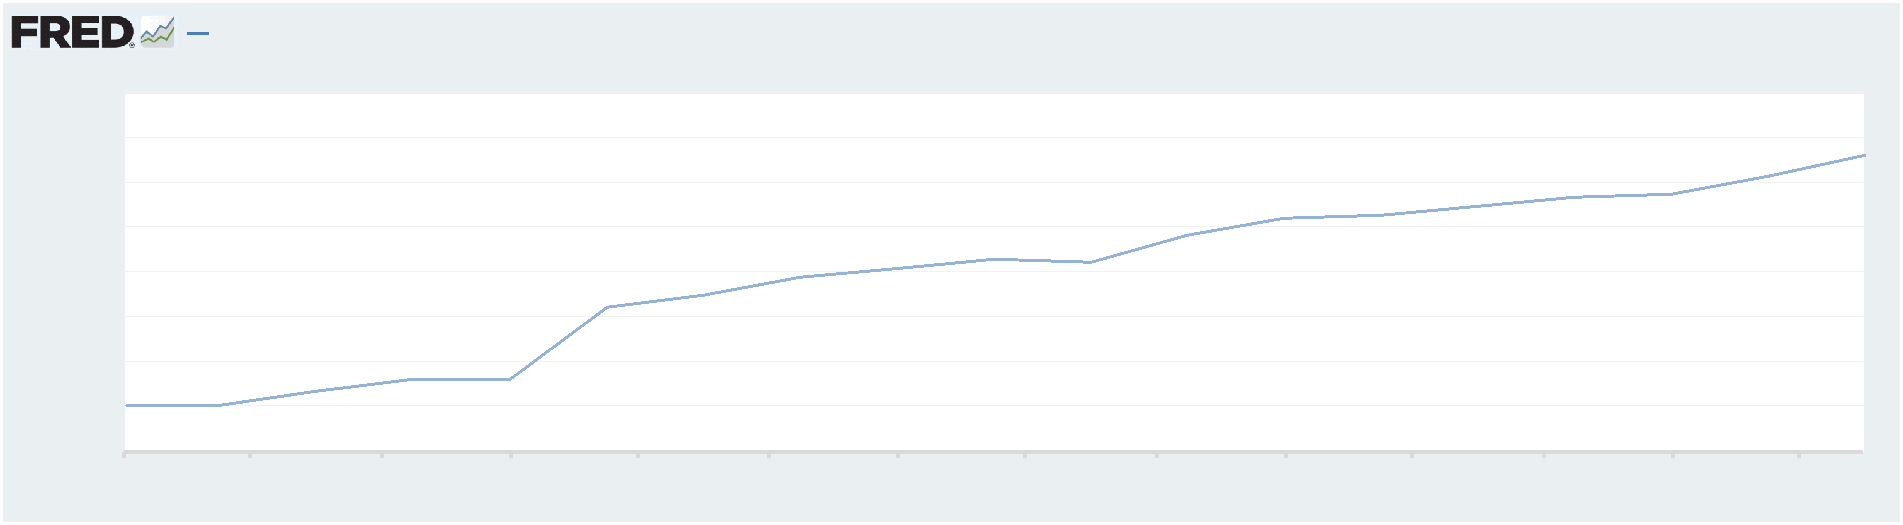
- Total Public Debt
- Total public debt outstanding was $34.57 trillion as of March 29, an increase of 9.9% from the previous year
- Debt held by the public was $24.64 trillion, and intragovernmental holdings were $7.09 trillion
- Inflation Factors
- CPI:
- The consumer-price index rose 3.2% in February year over year
- On a monthly basis, the CPI increased 0.4% in February on a seasonally adjusted basis, after increasing 0.3% in January
- The index for all items less food and energy (core CPI) rose 0.4% in February, after rising 0.4% in January
- Core CPI increased 3.8% for the 12 months ending February
- Food and Beverages:
- The food at home index increased 1.0% in February from the same month a year earlier, and decreased 0.0% in February month over month
- The food away from home index increased 4.5% in February from the same month a year earlier, and increased 0.1% in February month over month
- Commodities:
- The energy commodities index increased 3.6% in February after decreasing (3.2%)
- The energy commodities index fell (4.1%) over the last 12 months
- The energy services index 0.1% in February after increasing 2.5% in January
- The energy services index rose 0.5% over the last 12 months
- The gasoline index fell (3.9%) over the last 12 months
- The fuel oil index fell (5.4%) over the last 12 months
- The index for electricity rose 3.6% over the last 12 months
- The index for natural gas fell (8.8%) over the last 12 months
- Supply Chain:
- Drewry’s composite World Container Index decreased to $2,928.99 per 40ft container
- Drewry’s composite World Container Index has increased by 70.6% over the last 12 months
- Housing Market:
- The shelter index increased 0.4% in February after increasing 0.6% in January
- The rent index increased 0.4% in February after increasing 0.6% in January
- The index for lodging away from home increased 3.1% in February after increasing 4.3% in January
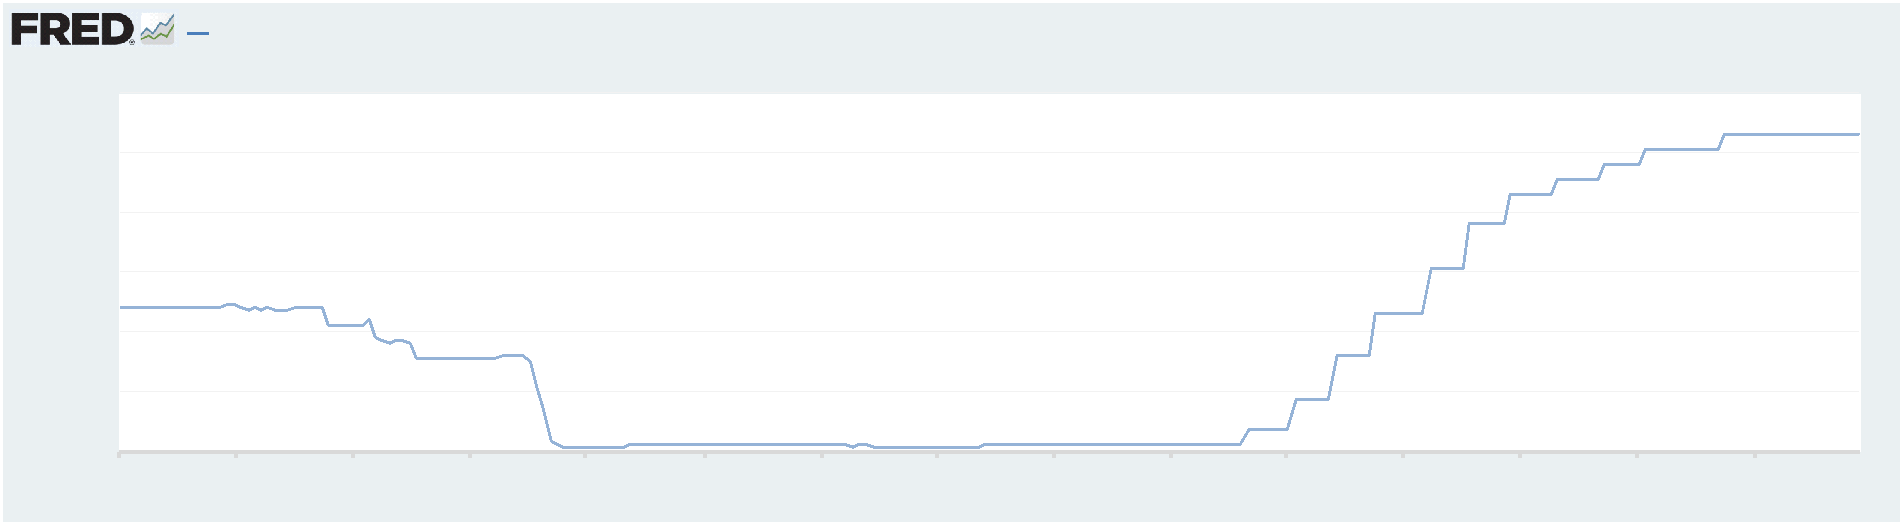
- Fed Funds Rate
- The effective Federal Funds Rate is at 5.33%, flat 0.00% year to date
World News
-
Israel
- Israeli airstrikes near the northern Syrian city of Aleppo killed and wounded numerous people this past week in one of the deadliest attacks in recent weeks
- Israel also exchanged attacks with Lebanon’s Hezbollah militia between the two countries
-
China
- China’s industrial profit jumped 10.2% in the first two months of 2024, compared to a 2.3% decline in 2023. The rebound is a sign that the world’s second-largest economy is on stronger footing than anticipated
- China state-owned companies reported a 0.5% rise in profits for January and February, while profits at foreign companies jumped 31.2%
- The main contributor to overall profit growth was equipment manufacturing, which is up 28.9% from a year ago
- The news comes in contrast to China’s property development companies, which have reported strained earnings or in the case of Country Garden, delayed release of annual results as they work to restructure its debt
-
Russia
- Russia blocked the United Nations from monitoring international sanctions against North Korea this past week. The move was aimed at preventing scrutiny of the arms trade between North Korea and Moscow
- Thirteen members of the 15-member Council voted to extend the monitoring with China abstaining. The monitoring will officially end at the end of April
-
Dominican Republic
- As a large portion of Port-au-Prince is now under the control of warlords and gang leaders, the Dominican Republic has moved to start construction of a border wall in order to protect itself from the ongoing violence in Haiti
-
Canada
- Canada GDP grows stronger than expected 0.6% in January and reinforces expectations that the Bank of Canda will stick keep rates flat
-
Japan
- The Bank of Japan ended negative interest rates and unwound most of its unconventional monetary easing policies, moving its key target for short-term rates to a range of 0% to 0.1%, its first rate increase since 2007
-
Taiwan
- Taiwan’s Defense Minister Chiu Kuo-cheng confirmed that U.S. troops have been training the Taiwanese military on outlying islands, including Kinmen, as part of mutual exchanges to improve Taiwan’s defense capabilities against potential conflicts with China
-
Australia
- Australian officials have unveiled a new policy aimed at reducing migration by 14% over the next four years in an effort to address housing affordability issues in cities like Sydney, where prices have reached record highs
-
Argentina
- President Javier Milei drives privatization despite congressional resistance, cutting costs by 456 billion pesos ($535 million) in February 2024. Companies like Aerolíneas Argentinas and YPF undergo restructuring, facing hurdles in Congress and valuation challenges in YPF’s state shares
-
India
- The Indian National Congress, the main opposition party in India, faced severe setbacks to its election campaign as tax authorities froze its accounts and seized its funds, hindering its ability to conduct campaign activities
-
South Africa
- Markus Jooste, former CEO of Steinhoff International, died from a self-inflicted gunshot wound a day after receiving a record fine for his role in the company’s collapse due to massive corporate fraud
Commodities
-
Oil Prices
- WTI: $83.17 per barrel
- +3.15% WoW; +16.08% YTD; +11.83% YoY
- Brent: $87.48 per barrel
- +2.40% WoW; +13.55% YTD; +10.36% YoY
-
US Production
- U.S. oil production amounted to 13.1 million bpd for the week ended March 22, up 0.1 million bpd
from the prior week
-
Rig Count
- The total number of oil rigs amounted to 621, down 3 from last week
-
Inventories
-
Crude Oil
- Total U.S. crude oil inventories now amount to 448.2 million barrels, down (5.4%) YoY
- Refiners operated at a capacity utilization rate of 88.7% for the week, up from 87.8% in the prior week
- U.S. crude oil imports now amount to 6.278 million barrels per day, down 25.9% YoY
-
Gasoline
- Retail average regular gasoline prices amounted to $3.54 per gallon in the week of March 29,
up 1.0% YoY
- Gasoline prices on the East Coast amounted to $3.49, up 2.8% YoY
- Gasoline prices in the Midwest amounted to $3.48, up 5.1% YoY
- Gasoline prices on the Gulf Coast amounted to $3.27, up 3.2% YoY
- Gasoline prices in the Rocky Mountain region amounted to $3.41, down (6.8%) YoY
- Gasoline prices on the West Coast amounted to $4.59, down 2.2% YoY
- Motor gasoline inventories were down by 1.3 million barrels from the prior week
- Motor gasoline inventories amounted to 232.1 million barrels, up 2.4% YoY
- Production of motor gasoline averaged 9.21 million bpd, down (8.2%) YoY
- Demand for motor gasoline amounted to 8.715 million bpd, down (4.7%) YoY
-
Distillates
- Distillate inventories decreased by 1.2 million in the week of March 29
- Total distillate inventories amounted to 117.3 million barrels, up 0.6% YoY
- Distillate production averaged 4.814 million bpd, up 3.9% YoY
- Demand for distillates averaged 4.028 million bpd in the week, up 8.5% YoY
-
Natural Gas
- Natural gas inventories decreased by 36 billion cubic feet last week
- Total natural gas inventories now amount to 2,296 billion cubic feet, up 23.9% YoY
Credit News
High yield bond yields decreased 3bps to 7.55% and spreads increased 4bps to 322bps. Leveraged loan yields decreased 2bps to 9.30% and spreads increased 3bps to 509bps. WTD Leveraged loan returns were positive 12bps. WTD high yield bond returns were positive 10bps. For the week, market was relatively inactive due to the holiday shorten week.
High-yield:
Week ended 03/29/2024
- Yields & Spreads1

- Pricing & Returns1

- Fund Flows2
- New Issue2

- Distressed Level (trading in excess of 1,000 bps)2

- Total HY Defaults

1 Source: Credit Suisse High Yield and Leveraged Loan Index
2 Source: JP Morgan
Leveraged loans:
Week ended 03/29/2024
- Yields & Spreads1

- Leveraged Loan Index1

- Fund Flows2
- New Issue2

- Distressed Level (loan price below $80)1

- Total Loan Defaults

Default activity:
- Most recent defaults include: Robertshaw ($820mn, 2/29/24), Thrasio LLC ($724mn, 2/28/24), Hornblower ($838mn, 2/20/24), Careismatic ($700mn, 1/22/24), Enviva Partners ($750mn, 1/15/24), Ligado Networks ($4.2bn, 11/1/23), and Air Methods ($1.7bn, 10/24/23).
CLOs:
Week ended 03/29/2024
- New U.S. CLO Issuance2

- New U.S. CLO Issuance2

Note:High-yield and leveraged loan yields and spreads are swap-adjusted
1 Source: Credit Suisse High Yield and Leveraged Loan Index
2 Source: JP Morgan
Ratings activity:
- S&P and Moody’s High Yield Ratings

Appendix:
Diagram A: Leveraged Loan Trading Levels
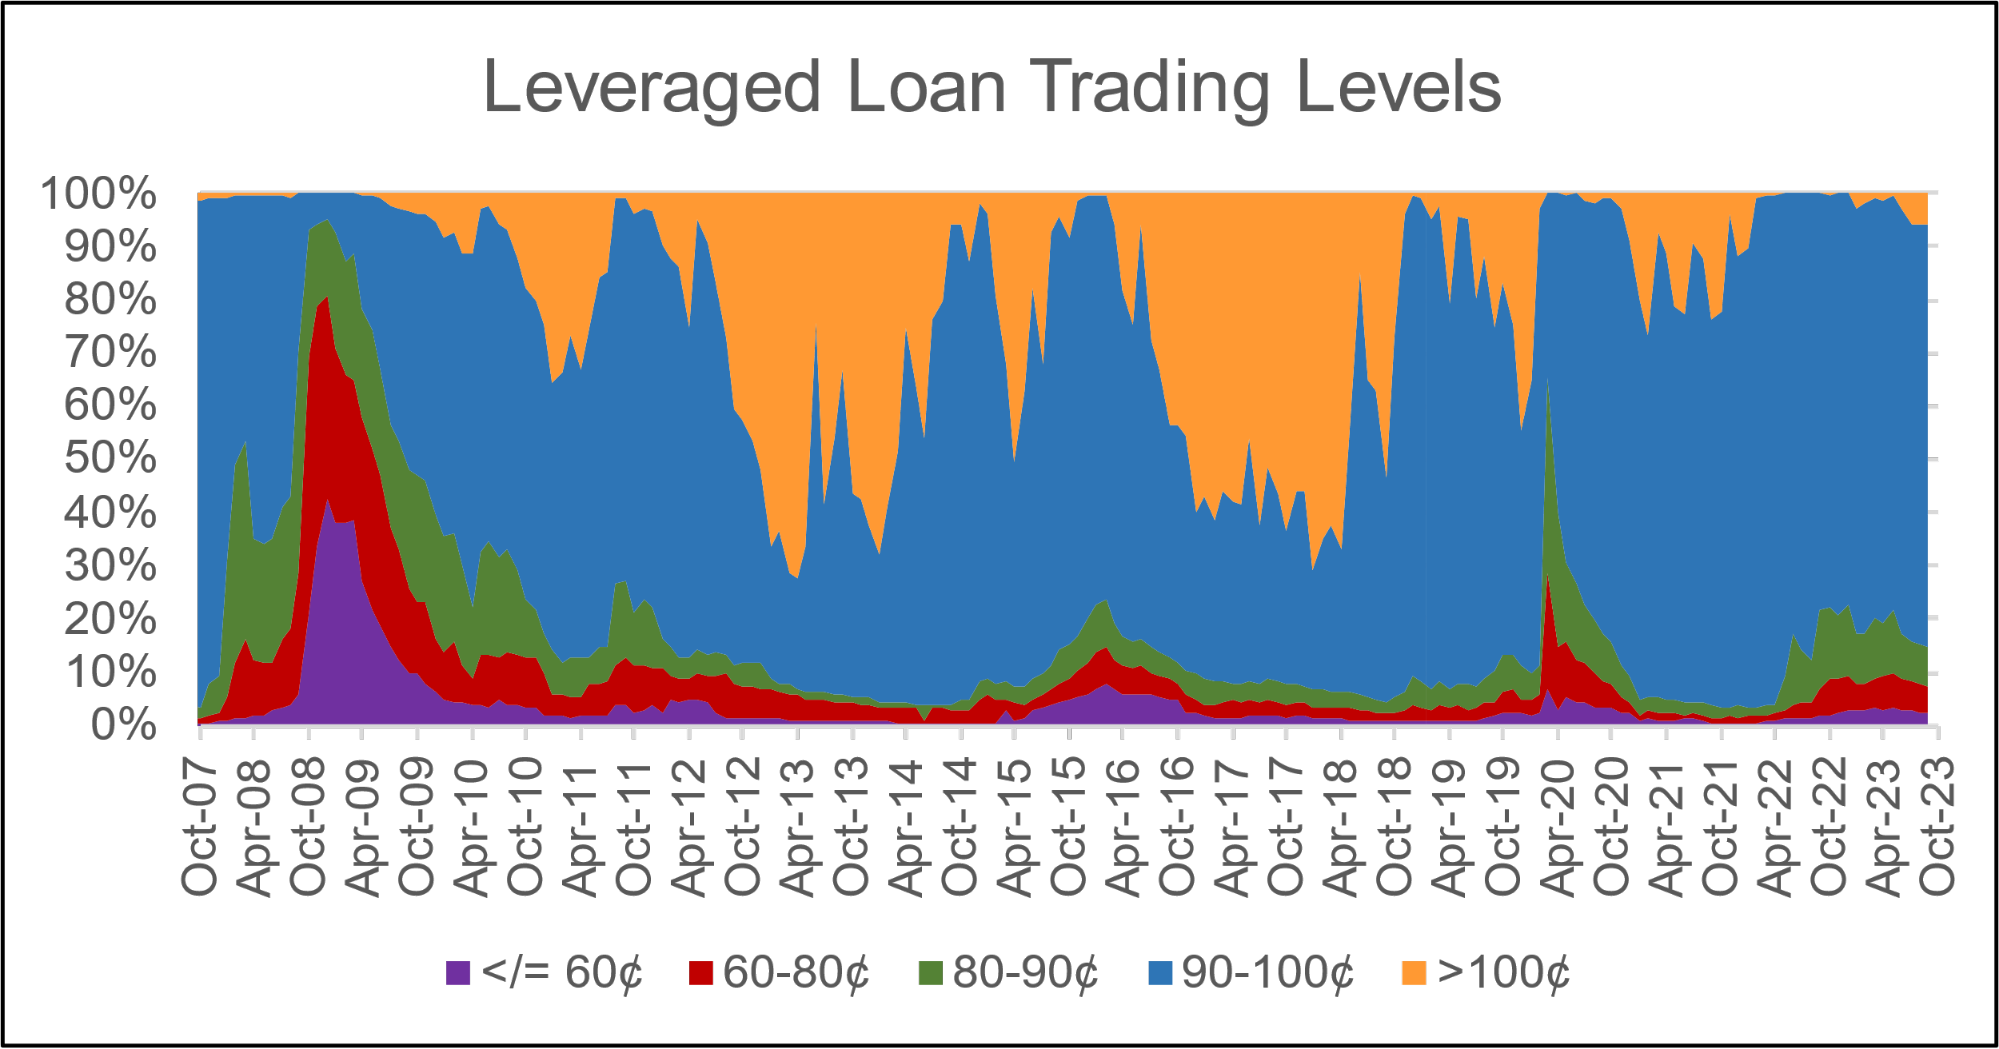
Source: Credit Suisse Leveraged Loan Index
Diagram B: High Yield and Leveraged Loan LTM Price
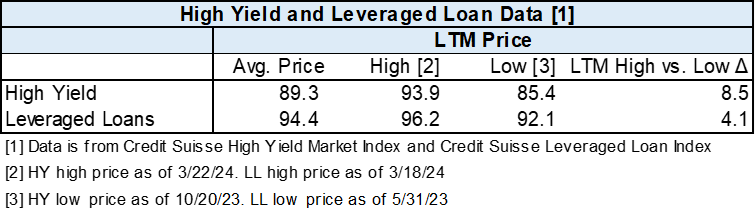
Diagram C: Leveraged Loan and High Yield Returns
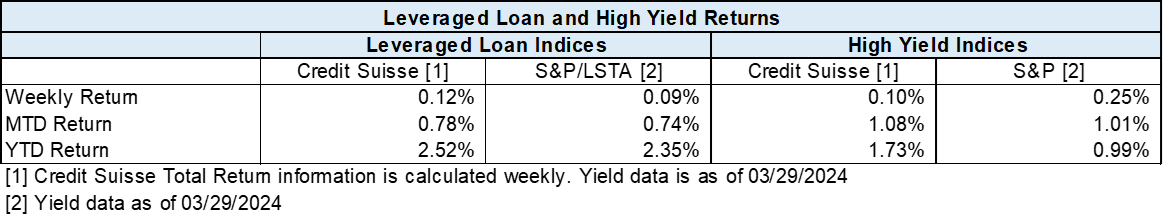
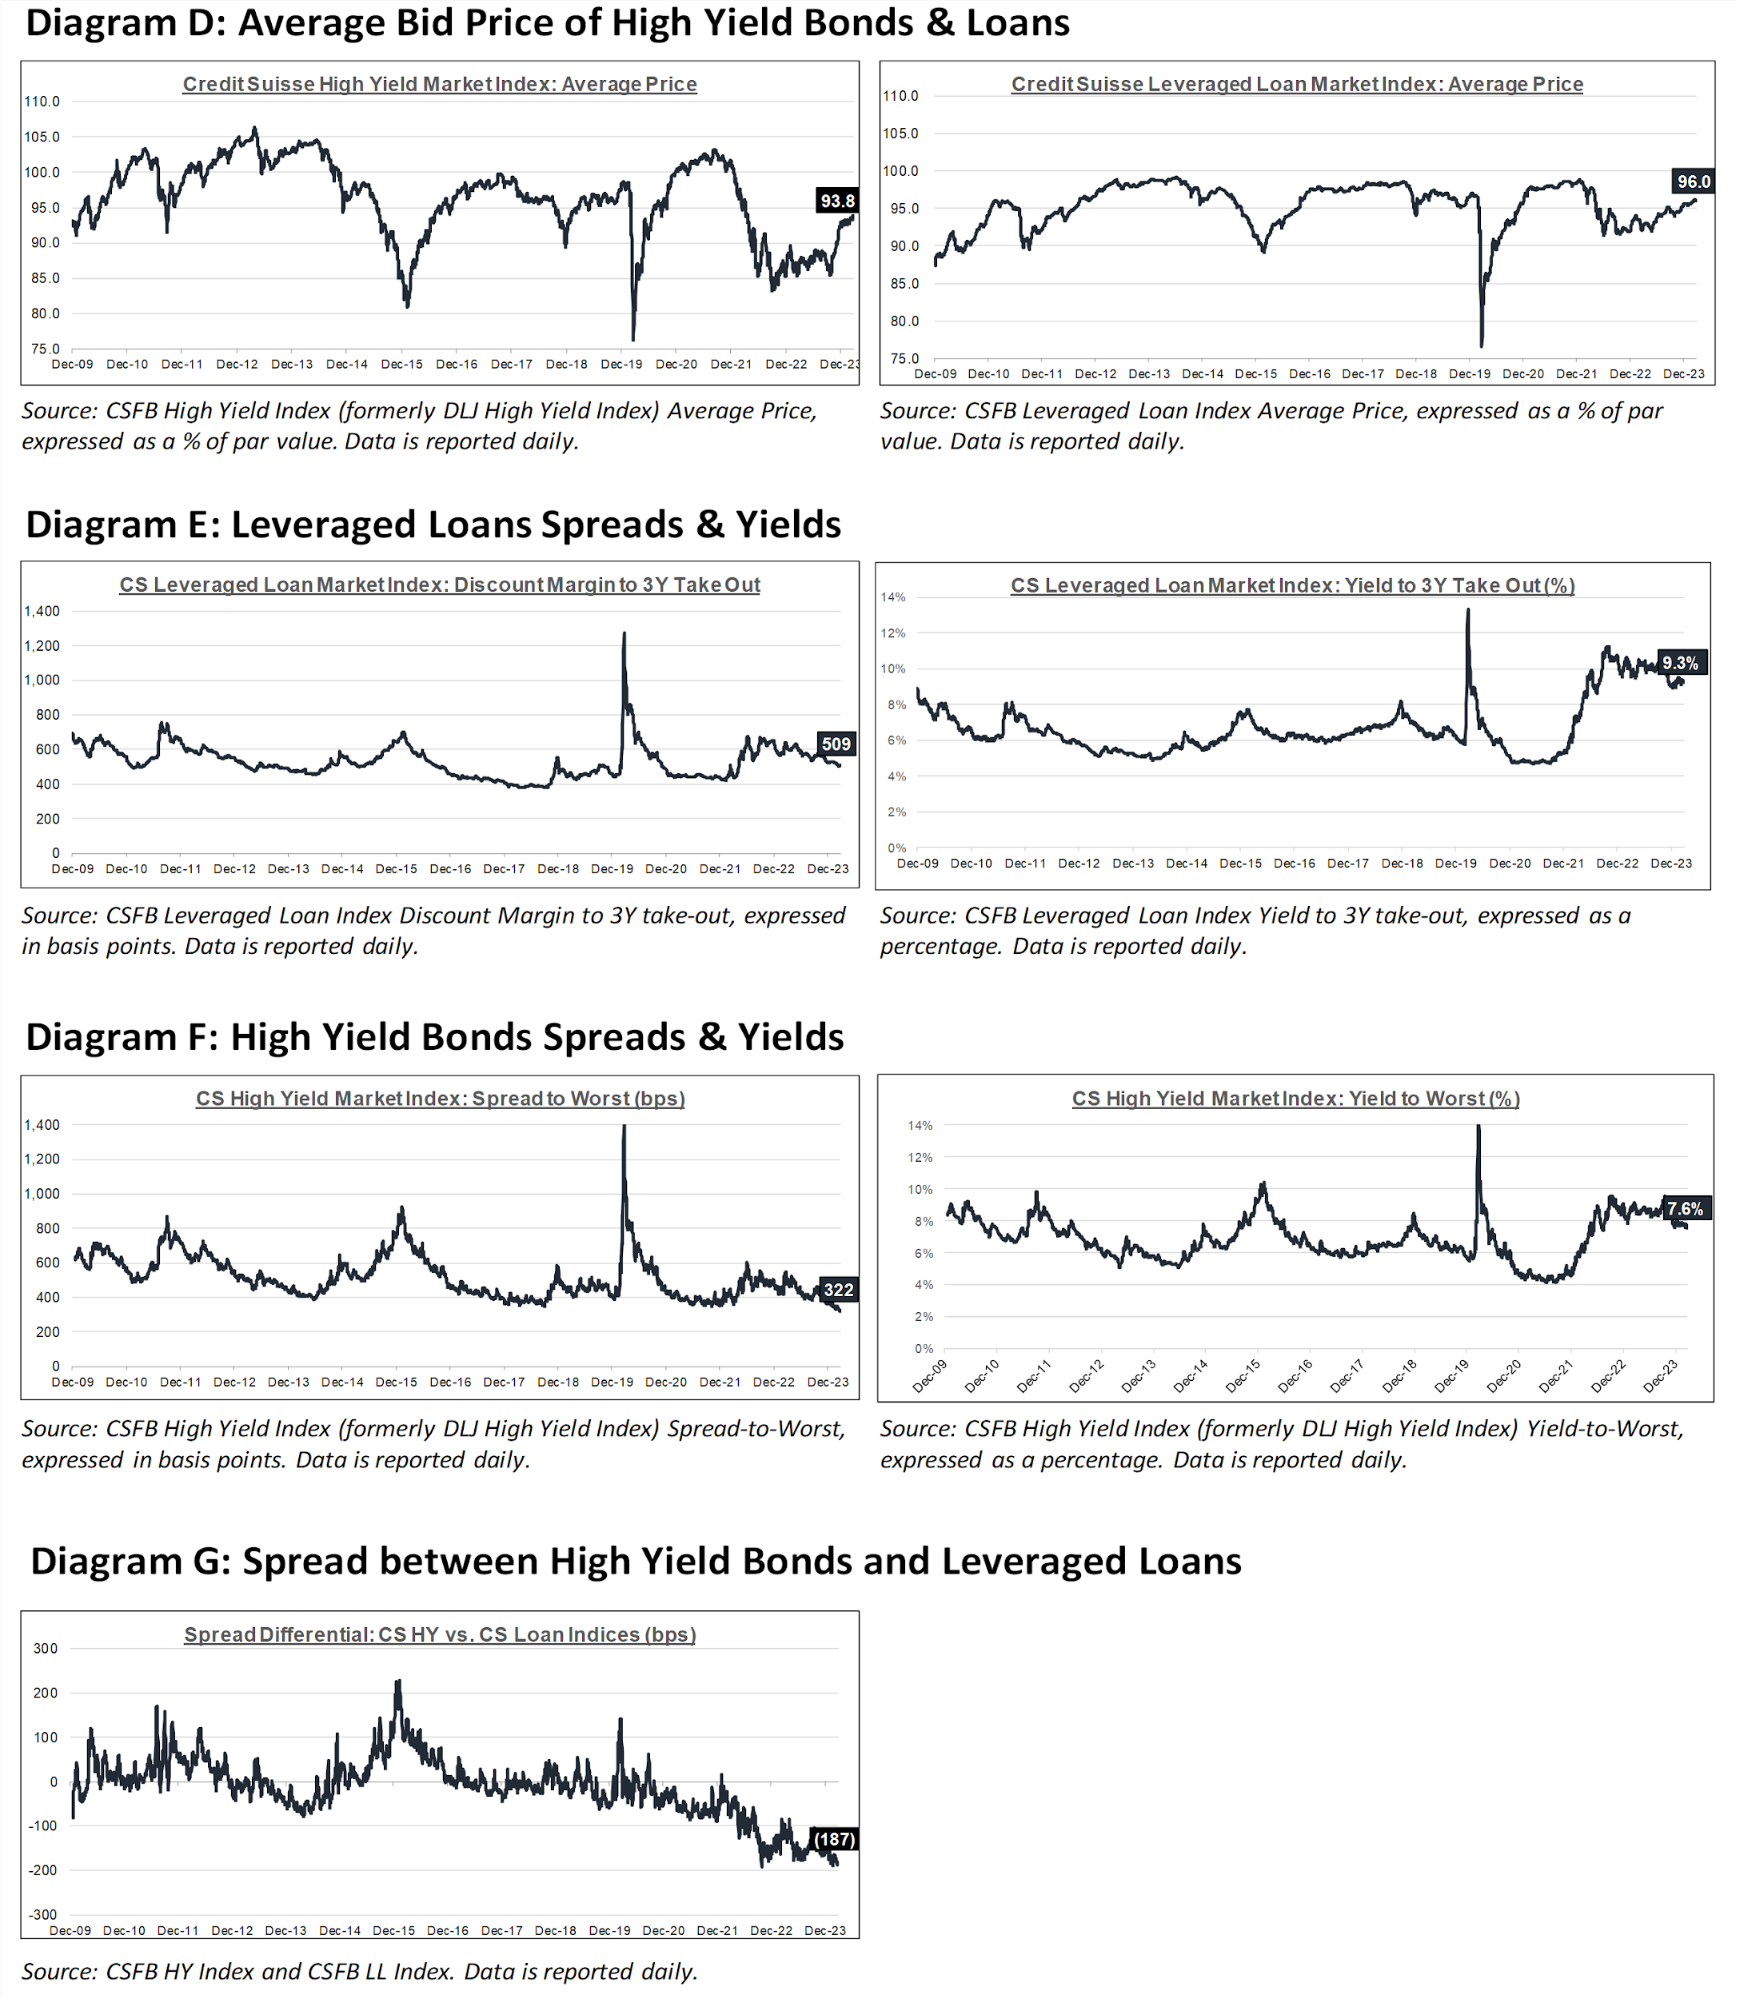
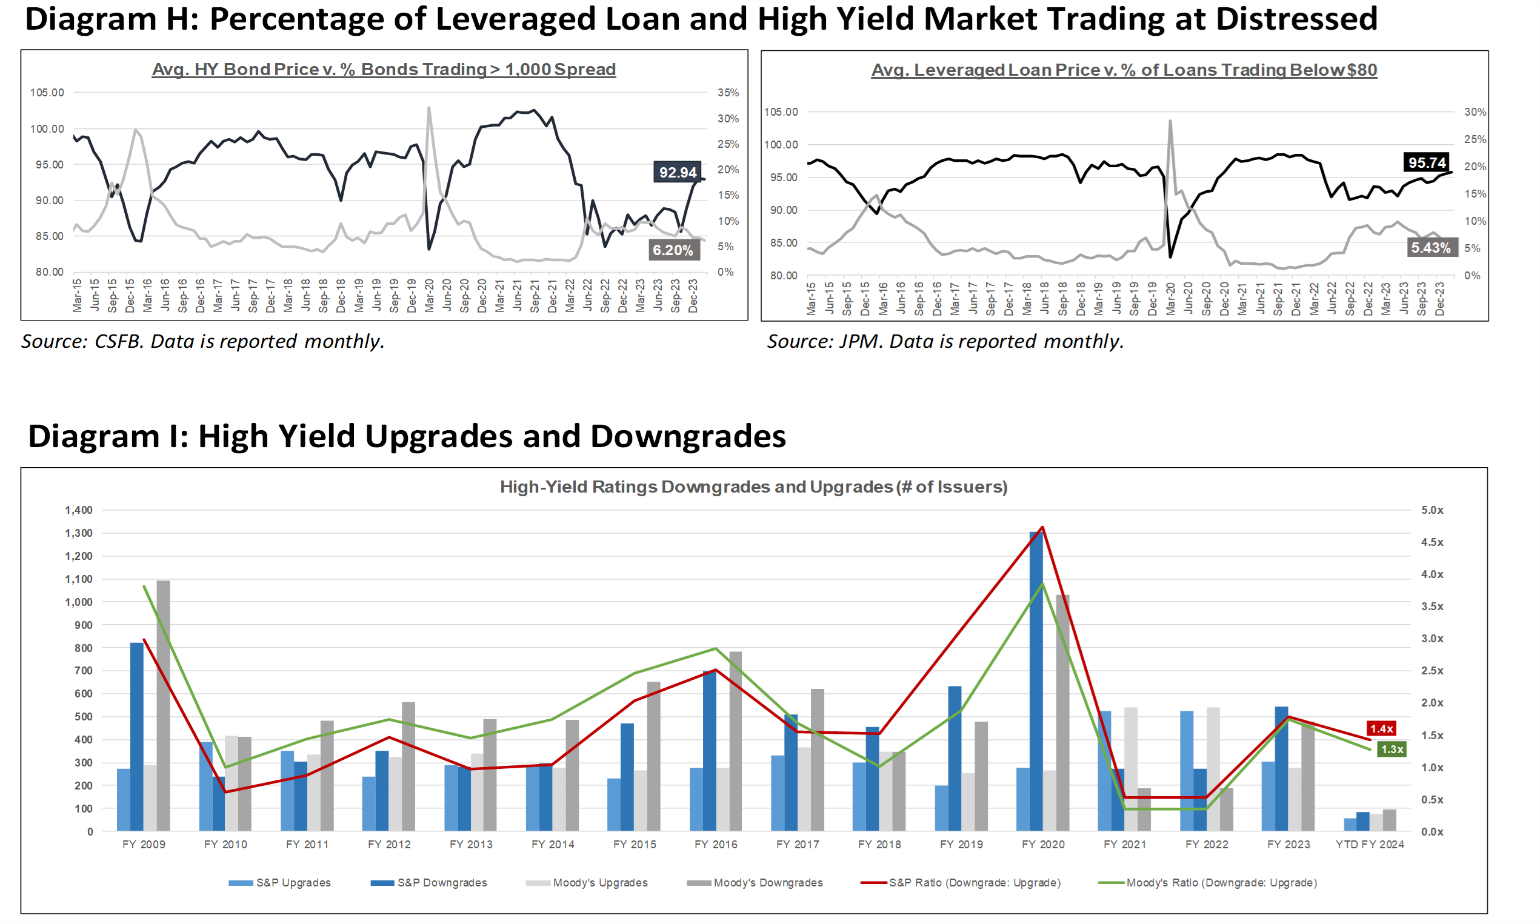
Diagram J: Leveraged Loan Defaults by Sector – Full Year
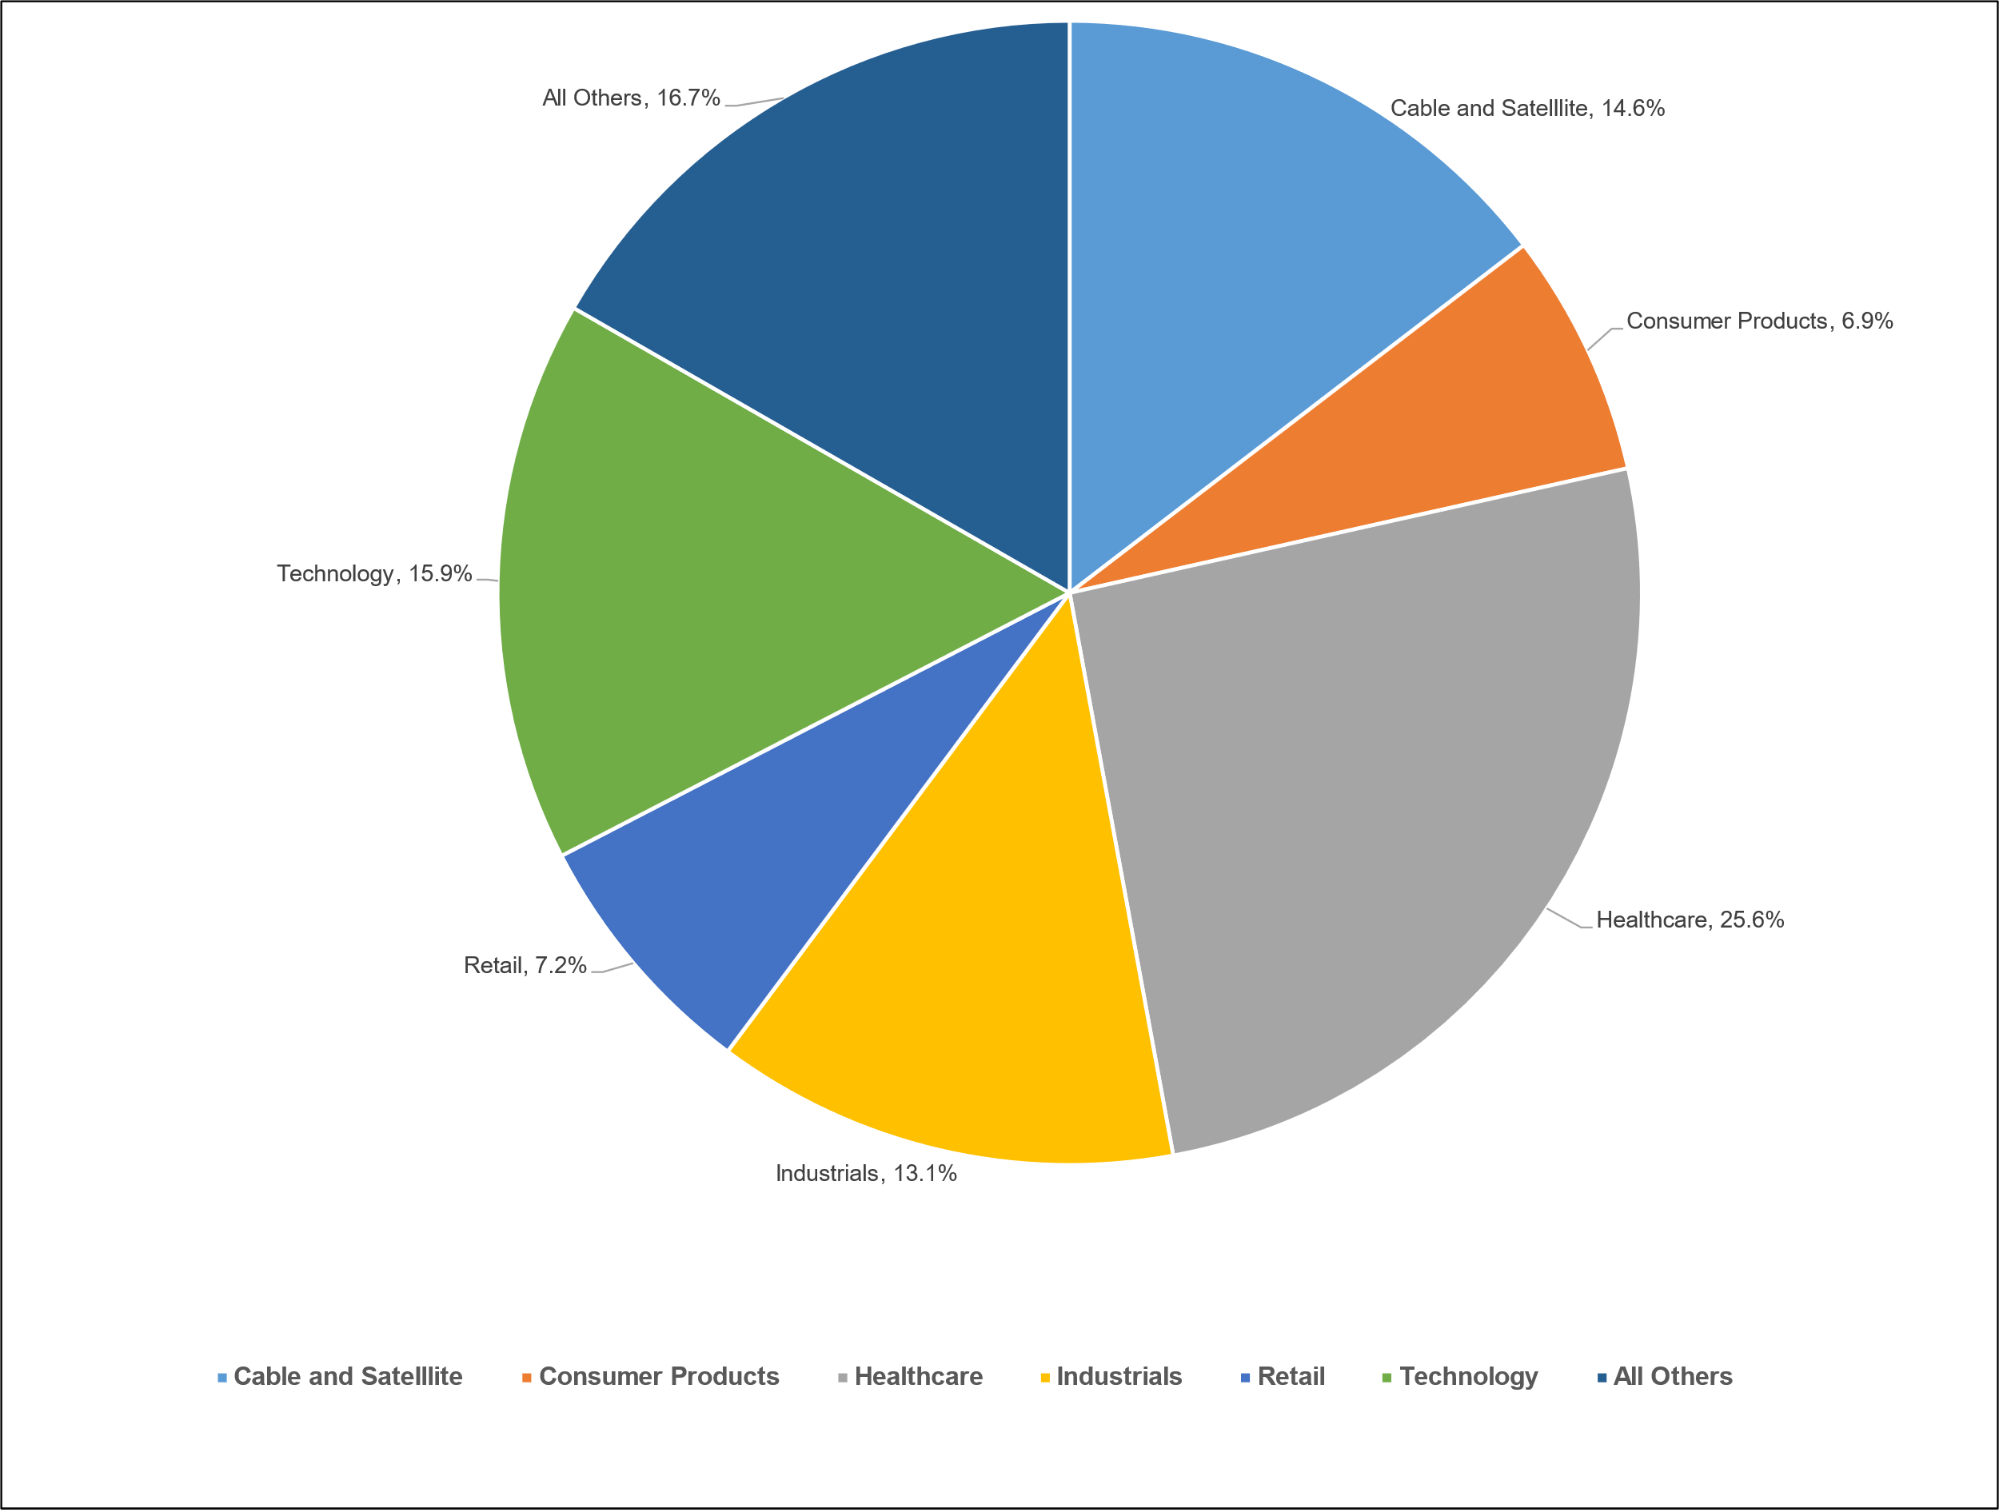
Diagram L: CLO Economics
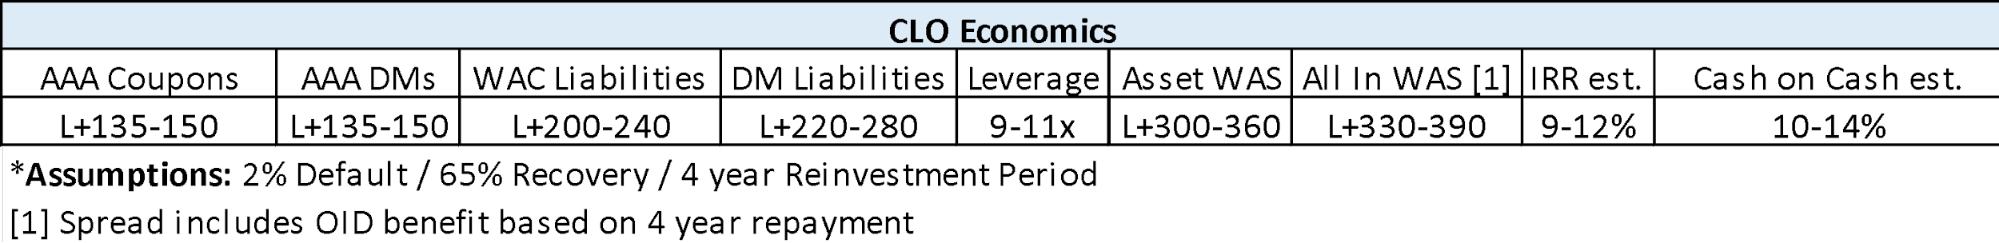
Diagram N: Developed Country GovBond Yields (%)
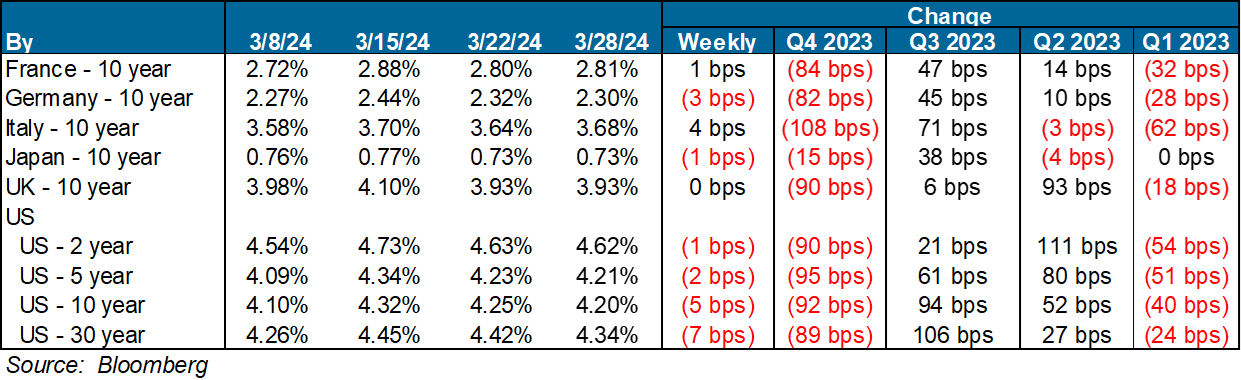
Diagram O: S&P 500 Historical Multiples
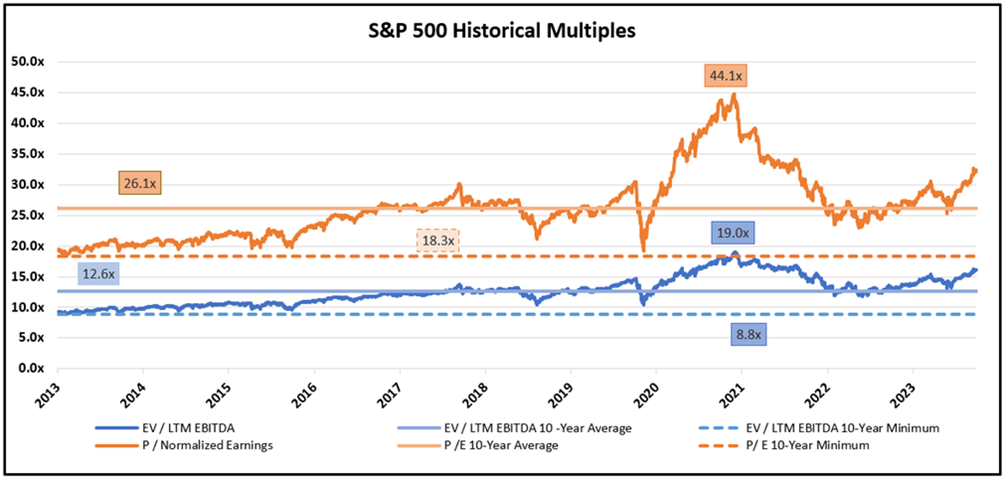
Diagram P: U.S. Middle-Market M&A Valuations (EV/EBITDA)
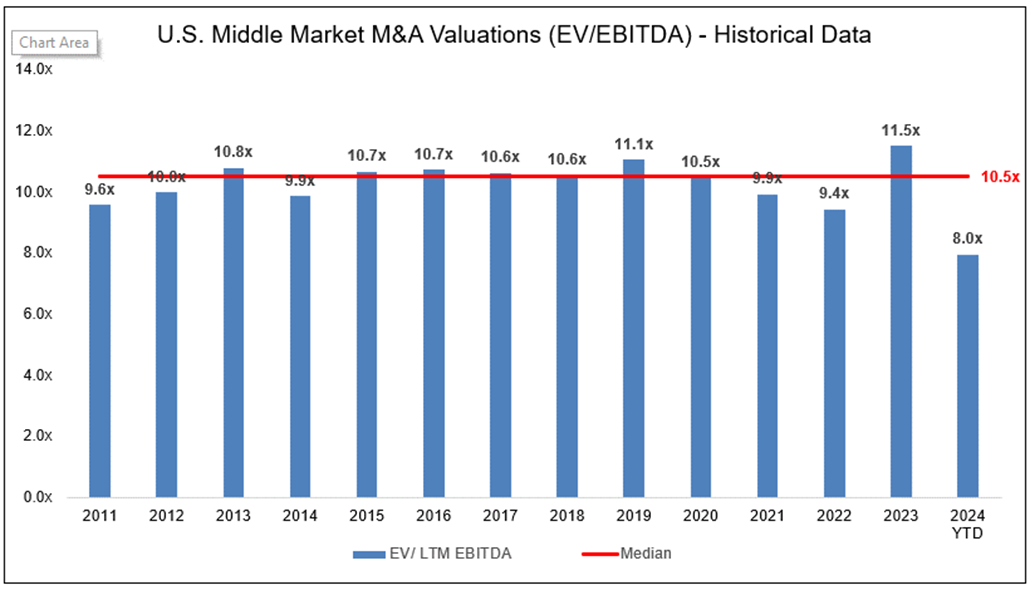
Diagram Q: U.S. Large Cap M&A Valuations (EV/EBITDA
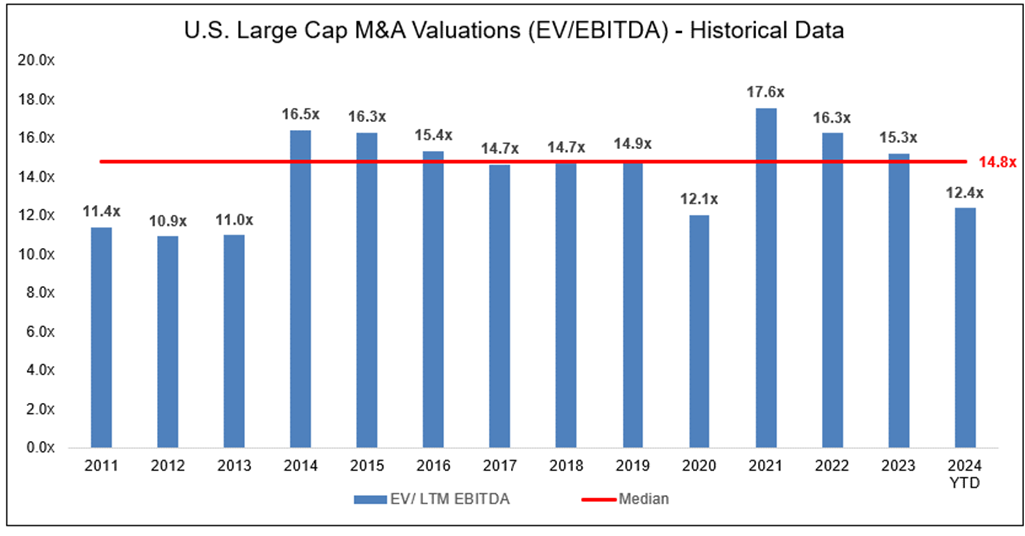
Diagram R: Dry Powder for All Private Equity Buyouts
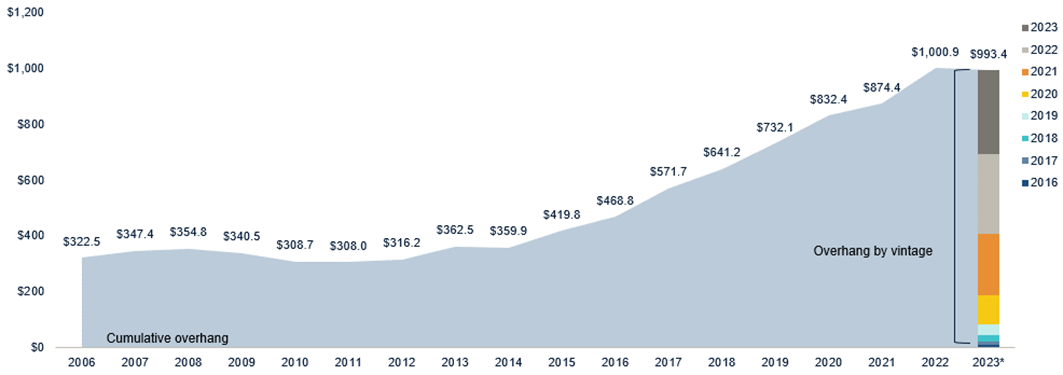
Diagram S: Structured Credit Spreads
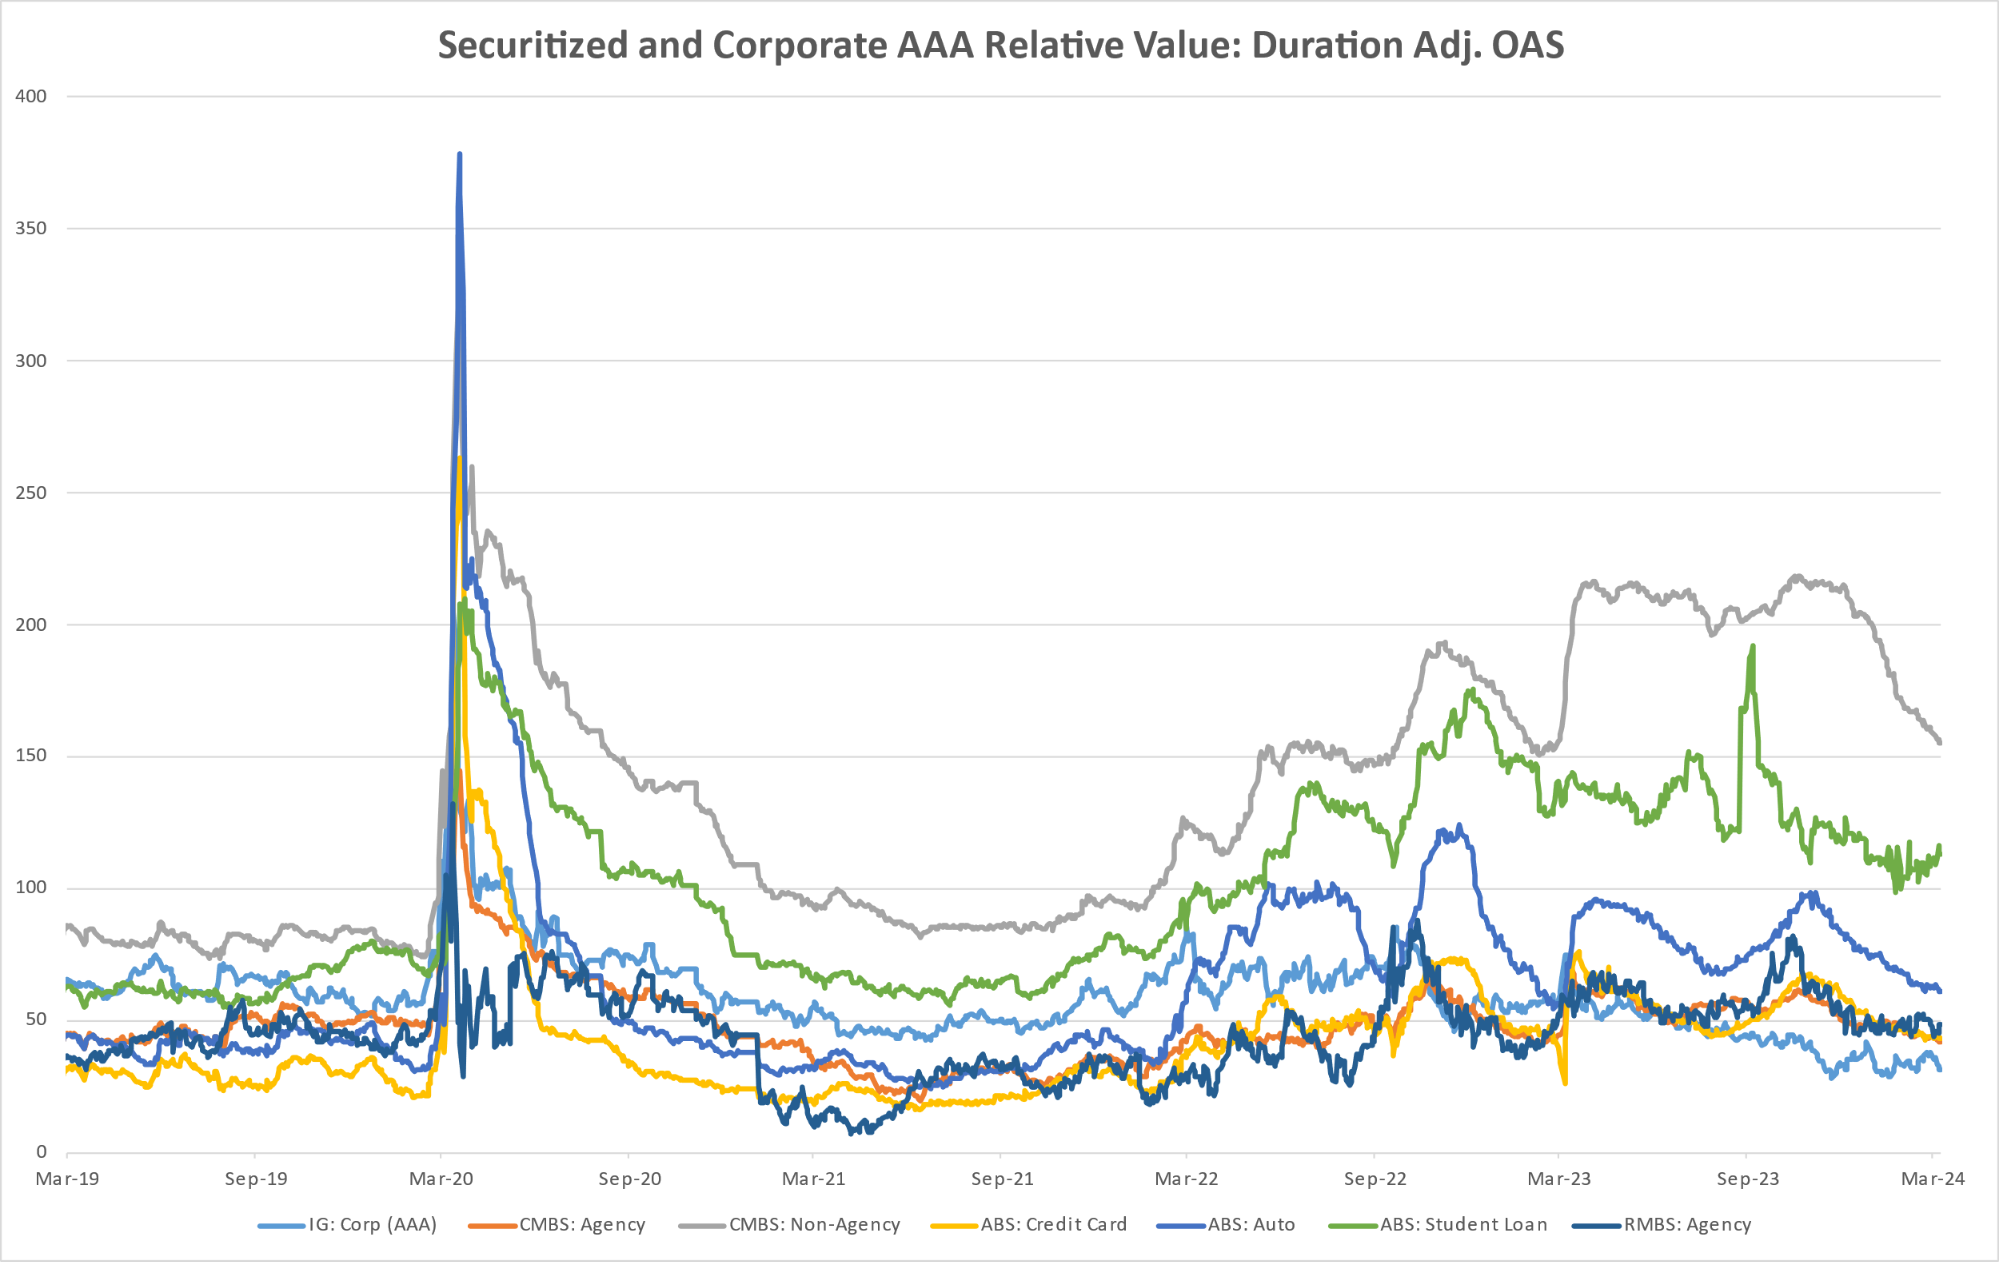
Diagram T: Structured Credit Yield
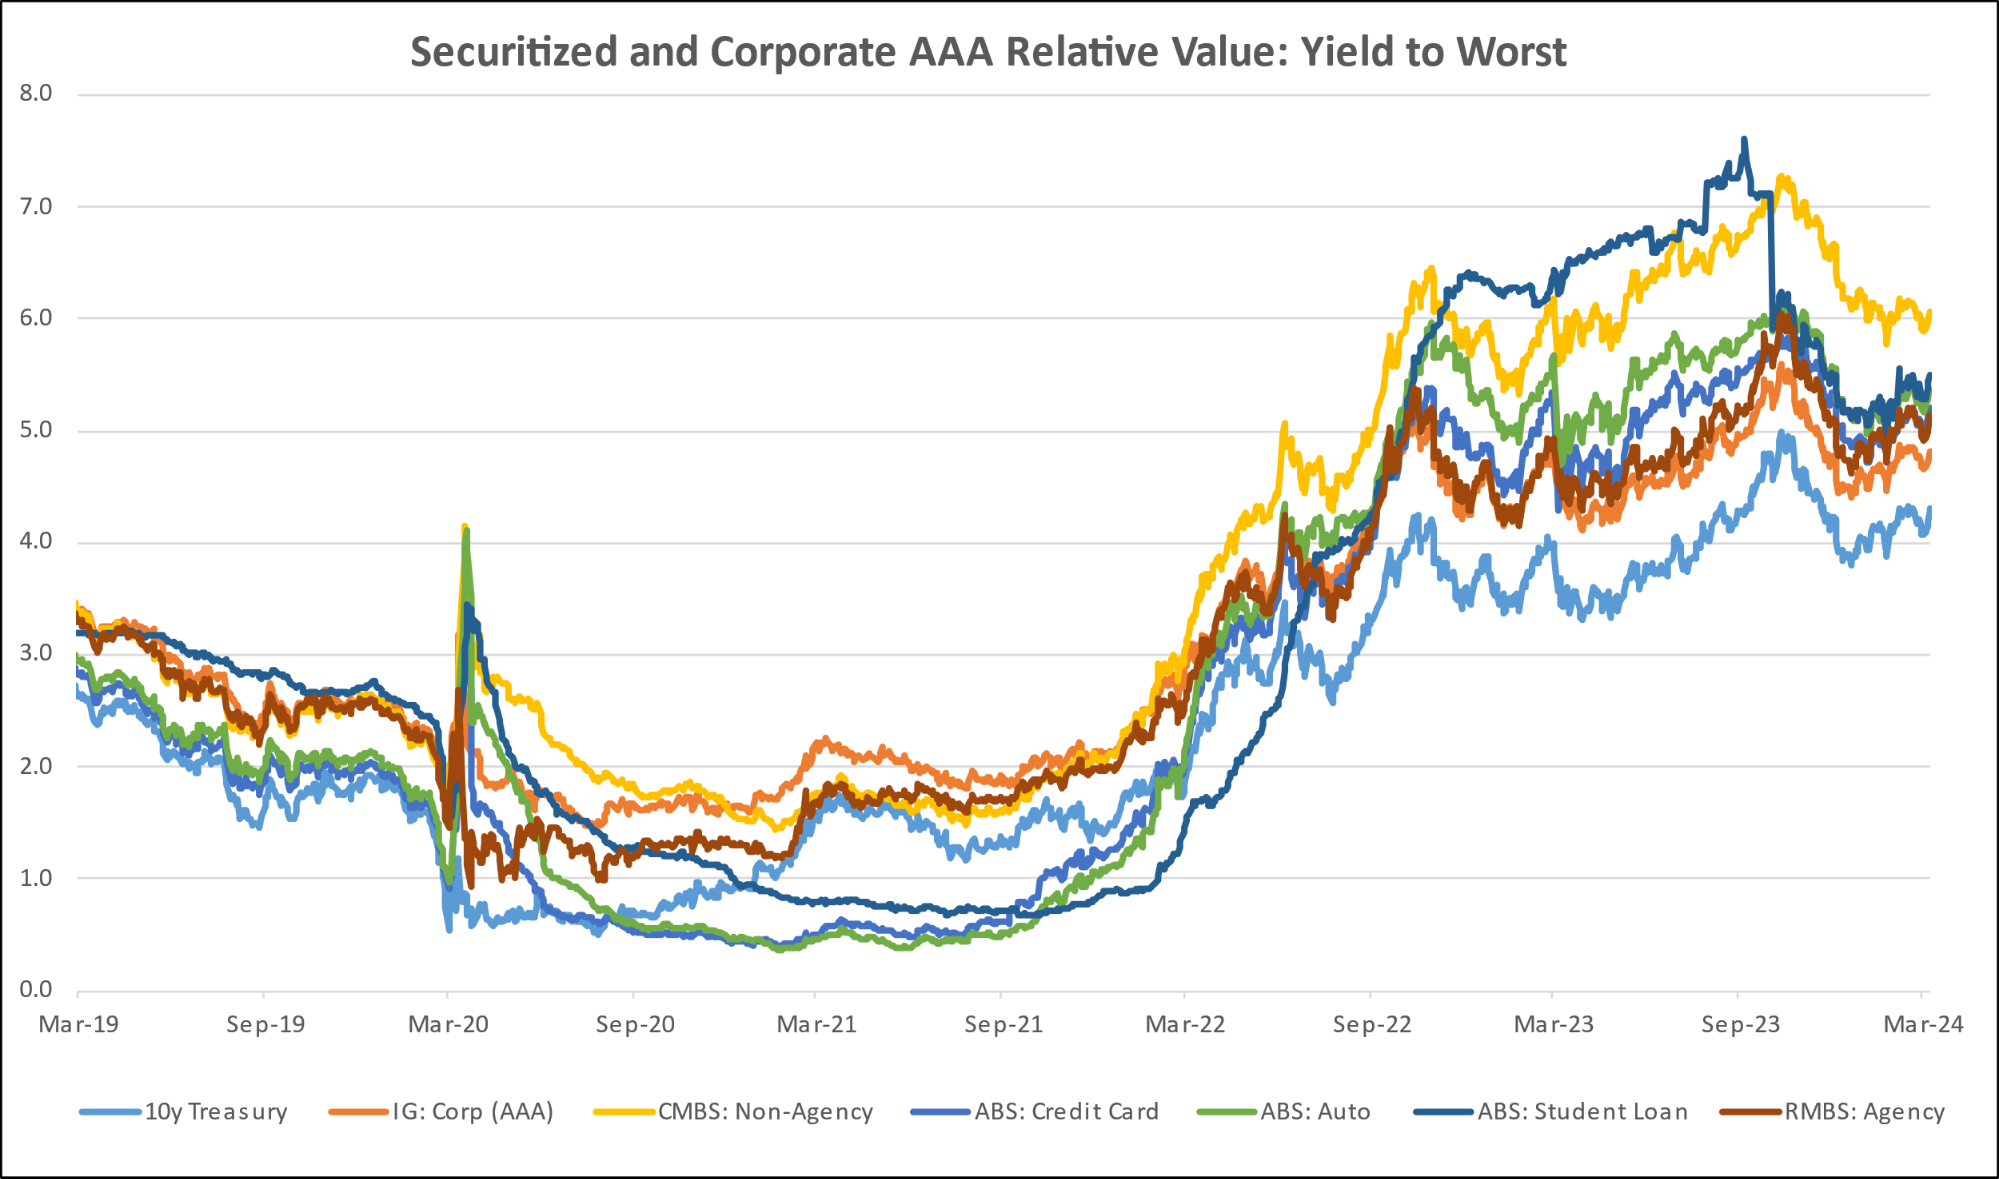
Diagram U: CAT Bonds – Cumulative Returns
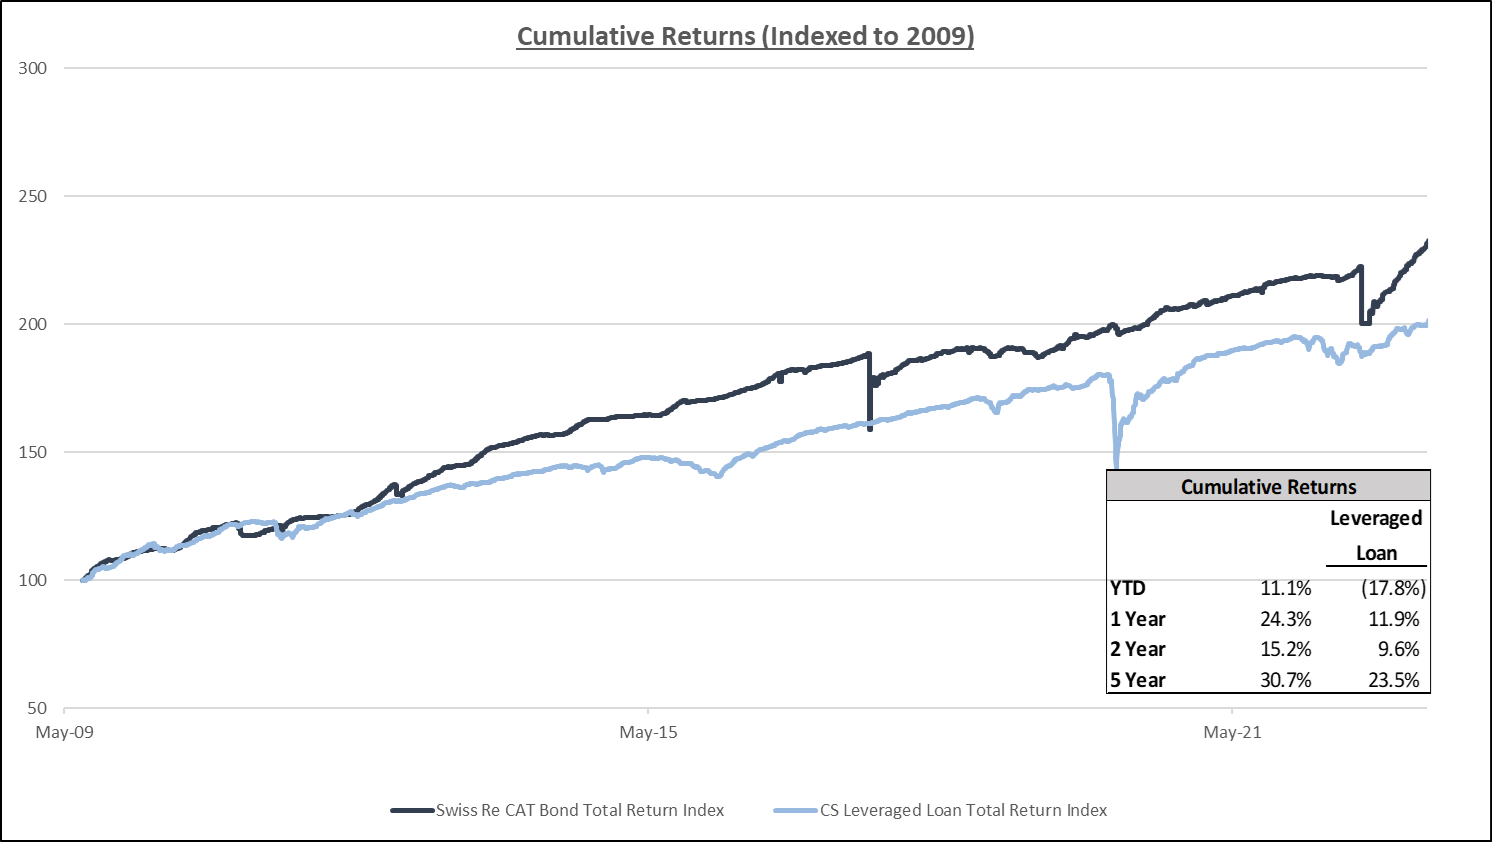
Diagram V: SOFR CURVE
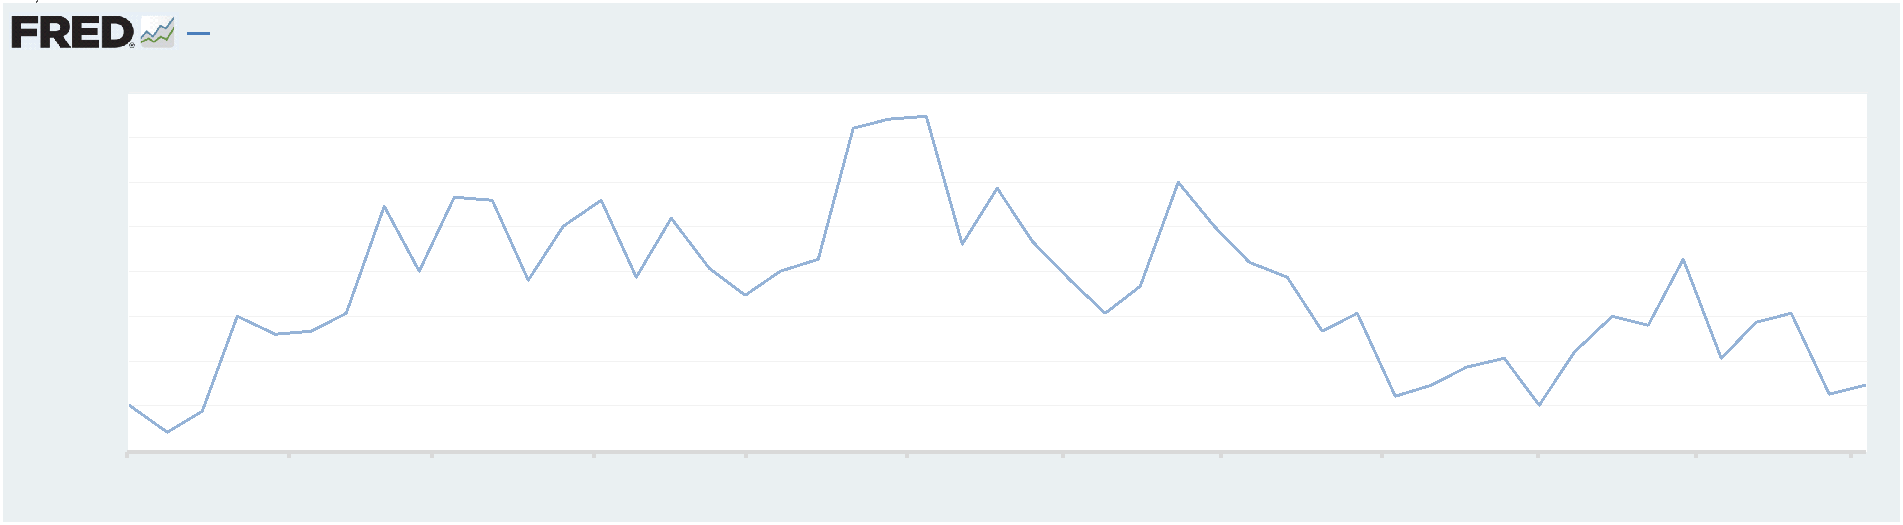
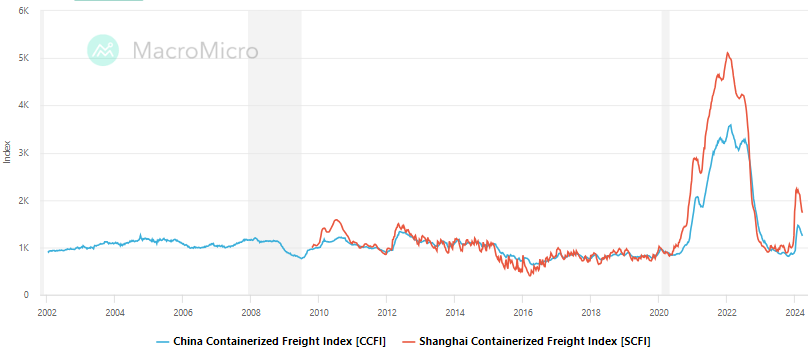
Freight Rates
Drewry World Container Index
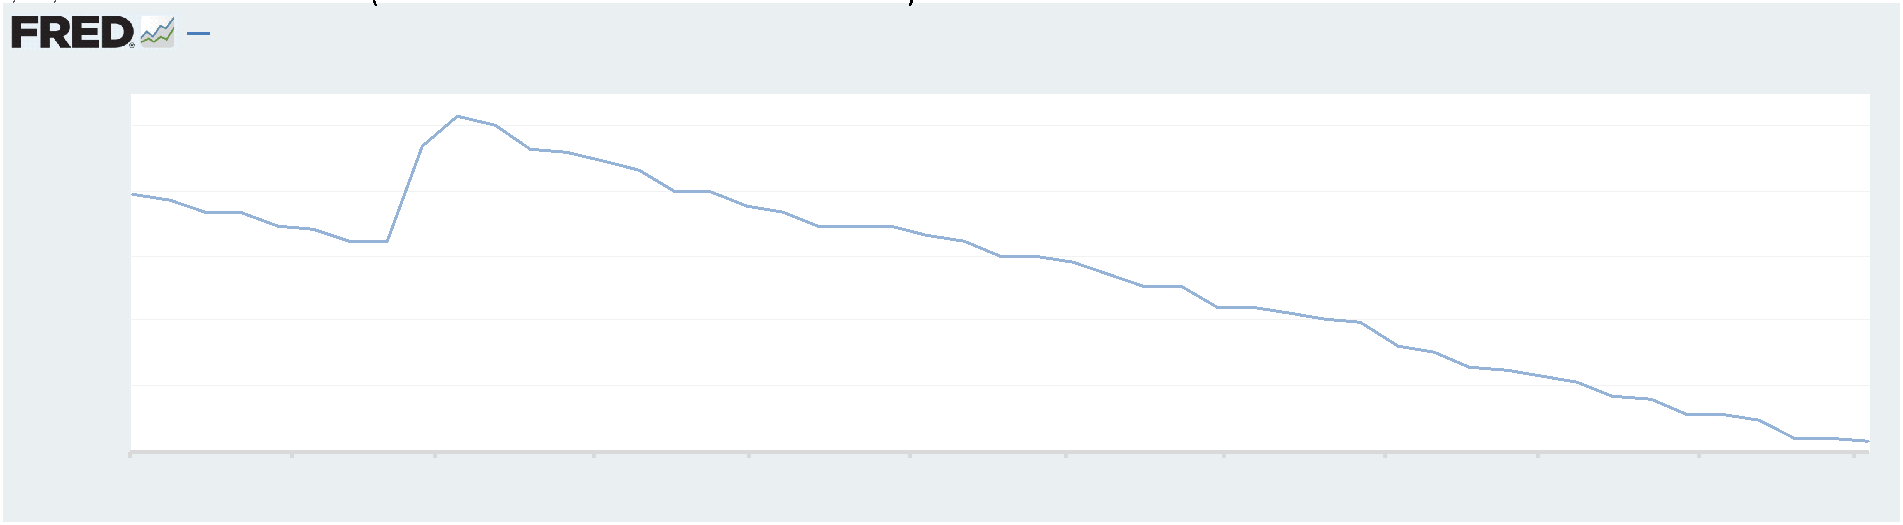
China-Global & Shanghai Export Container Freight Index
ZCGC RE Research: Shift in Homebuilders Strategy for New Single Family Build Outs
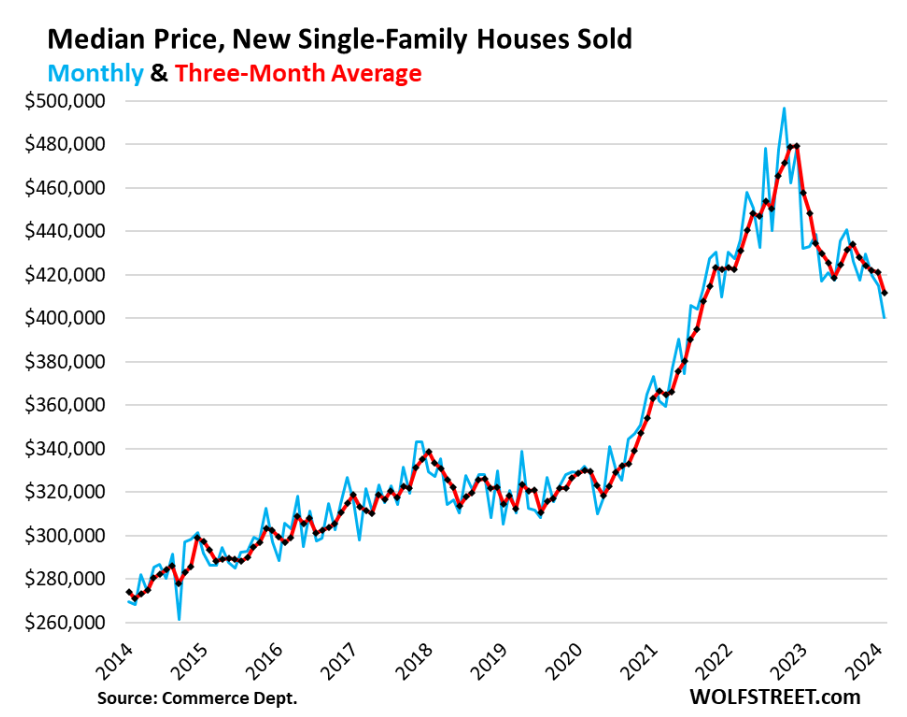
- Home builders are constructing smaller, more affordable homes with simpler amenities, responding to market demands for lower-cost housing options.
- The median price of new single-family houses dropped to $400,500 in February, the lowest since June 2021, reflecting a deliberate move to lower prices, which has included offering mortgage-rate buydowns among other incentives to attract buyers.
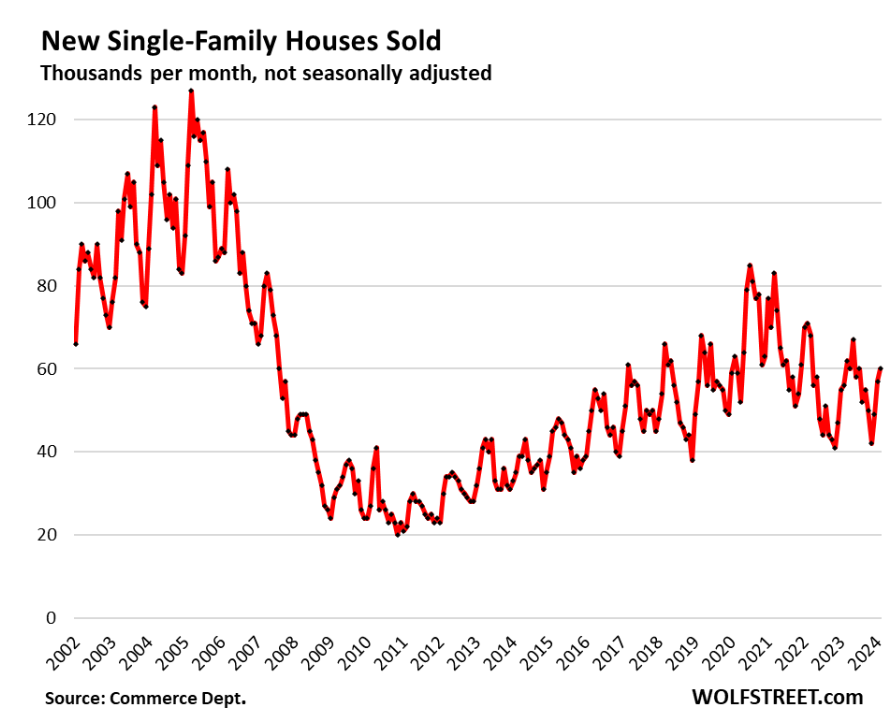
- There was a slight rise in sales, with new homes sold in February reaching 60,000, up 7.1% from the previous year, indicating that these strategies are drawing interest.
- This shift is a direct response to the oversupply in multifamily housing, oversupply of single family homes, there were 456,000 new houses for sale at all stages of construction translating into 7.8 months of supply, as well as the high mortgage rates, challenging single family builders to find innovative ways to maintain sales momentum.
U.S. News
- PCE Index
- The PCE index rose 0.3% in February and 2.8% on an annualized basis
- PCE, excluding food and energy, also increased by 0.3% in February and 2.5% on an annualized basis
- Consumer spending increased 0.8% for February, higher than the 0.5% estimate
- Consumer Confidence
- Consumer confidence fell in March to a four-month low as persistent inflation and the 2024 presidential election made Americans more anxious
- Consumer confidence now stands at 104.7 in March, down from 106.7 in February
- American’s short-term expectations for the economy fell to 73.8 in February; a reading below 80 can signal a potential recession in the near future
- New Home Sales
- U.S. new home sales fell 0.3% to an annual rate of 662,000 in February. Economists had expected 675,000 in February
- New home sales fell sharply in the Northeast by 31.5% and in the Midwest by 2.4%
- The median sales price of a new home sold in February fell to $400,500 from $414,900 and the supply of new homes rose 1.2% in February
- Jobless Claims
- Initial jobless claims, a measure of how many workers were laid off across the U.S., decreased to 210,000 in the week ended March 22, down 2,000 from the prior week
- The four-week moving average was 211,000, down 750 from the prior week
- Continuing claims – those filed by workers unemployed for longer than a week – increased by 24,000 to 1.819 million in the week ended March 15. This figure is reported with a one-week lag
- Fed’s Balance Sheet
- The Federal Reserve’s assets totaled $7.485 trillion in the week ended March 29, down $29.6 billion from the prior week
- Treasury holdings totaled $4.619 trillion, down $3.1 billion from the prior week
- Holdings of mortgage-backed securities (MBS) were $2.40 trillion in the week, down $8.2 billion from the prior week
- Total Public Debt
- Total public debt outstanding was $34.57 trillion as of March 29, an increase of 9.9% from the previous year
- Debt held by the public was $24.64 trillion, and intragovernmental holdings were $7.09 trillion
- Inflation Factors
- CPI:
- The consumer-price index rose 3.2% in February year over year
- On a monthly basis, the CPI increased 0.4% in February on a seasonally adjusted basis, after increasing 0.3% in January
- The index for all items less food and energy (core CPI) rose 0.4% in February, after rising 0.4% in January
- Core CPI increased 3.8% for the 12 months ending February
- Food and Beverages:
- The food at home index increased 1.0% in February from the same month a year earlier, and decreased 0.0% in February month over month
- The food away from home index increased 4.5% in February from the same month a year earlier, and increased 0.1% in February month over month
- Commodities:
- The energy commodities index increased 3.6% in February after decreasing (3.2%)
- The energy commodities index fell (4.1%) over the last 12 months
- The energy services index 0.1% in February after increasing 2.5% in January
- The energy services index rose 0.5% over the last 12 months
- The gasoline index fell (3.9%) over the last 12 months
- The fuel oil index fell (5.4%) over the last 12 months
- The index for electricity rose 3.6% over the last 12 months
- The index for natural gas fell (8.8%) over the last 12 months
- Supply Chain:
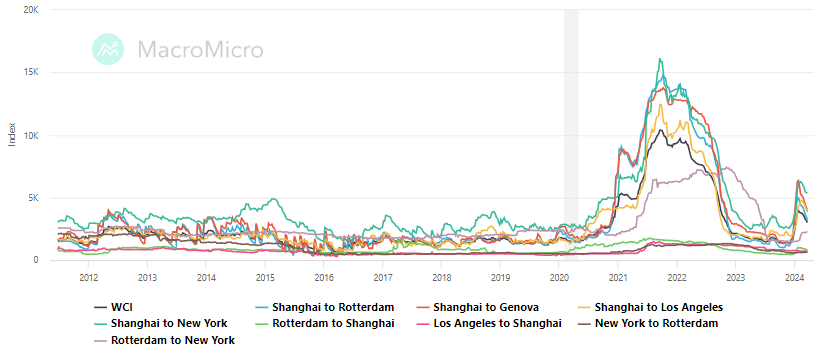
- Drewry’s composite World Container Index decreased to $2,928.99 per 40ft container
- Drewry’s composite World Container Index has increased by 70.6% over the last 12 months
- Housing Market:
- The shelter index increased 0.4% in February after increasing 0.6% in January
- The rent index increased 0.4% in February after increasing 0.6% in January
- The index for lodging away from home increased 3.1% in February after increasing 4.3% in January
- Fed Funds Rate
- The effective Federal Funds Rate is at 5.33%, flat 0.00% year to date
World News
-
Israel
- Israeli airstrikes near the northern Syrian city of Aleppo killed and wounded numerous people this past week in one of the deadliest attacks in recent weeks
- Israel also exchanged attacks with Lebanon’s Hezbollah militia between the two countries
-
China
- China’s industrial profit jumped 10.2% in the first two months of 2024, compared to a 2.3% decline in 2023. The rebound is a sign that the world’s second-largest economy is on stronger footing than anticipated
- China state-owned companies reported a 0.5% rise in profits for January and February, while profits at foreign companies jumped 31.2%
- The main contributor to overall profit growth was equipment manufacturing, which is up 28.9% from a year ago
- The news comes in contrast to China’s property development companies, which have reported strained earnings or in the case of Country Garden, delayed release of annual results as they work to restructure its debt
-
Russia
- Russia blocked the United Nations from monitoring international sanctions against North Korea this past week. The move was aimed at preventing scrutiny of the arms trade between North Korea and Moscow
- Thirteen members of the 15-member Council voted to extend the monitoring with China abstaining. The monitoring will officially end at the end of April
-
Dominican Republic
- As a large portion of Port-au-Prince is now under the control of warlords and gang leaders, the Dominican Republic has moved to start construction of a border wall in order to protect itself from the ongoing violence in Haiti
-
Canada
- Canada GDP grows stronger than expected 0.6% in January and reinforces expectations that the Bank of Canda will stick keep rates flat
-
Japan
- The Bank of Japan ended negative interest rates and unwound most of its unconventional monetary easing policies, moving its key target for short-term rates to a range of 0% to 0.1%, its first rate increase since 2007
-
Taiwan
- Taiwan’s Defense Minister Chiu Kuo-cheng confirmed that U.S. troops have been training the Taiwanese military on outlying islands, including Kinmen, as part of mutual exchanges to improve Taiwan’s defense capabilities against potential conflicts with China
-
Australia
- Australian officials have unveiled a new policy aimed at reducing migration by 14% over the next four years in an effort to address housing affordability issues in cities like Sydney, where prices have reached record highs
-
Argentina
- President Javier Milei drives privatization despite congressional resistance, cutting costs by 456 billion pesos ($535 million) in February 2024. Companies like Aerolíneas Argentinas and YPF undergo restructuring, facing hurdles in Congress and valuation challenges in YPF’s state shares
-
India
- The Indian National Congress, the main opposition party in India, faced severe setbacks to its election campaign as tax authorities froze its accounts and seized its funds, hindering its ability to conduct campaign activities
-
South Africa
- Markus Jooste, former CEO of Steinhoff International, died from a self-inflicted gunshot wound a day after receiving a record fine for his role in the company’s collapse due to massive corporate fraud
Commodities
-
Oil Prices
- WTI: $83.17 per barrel
- +3.15% WoW; +16.08% YTD; +11.83% YoY
- Brent: $87.48 per barrel
- +2.40% WoW; +13.55% YTD; +10.36% YoY
-
US Production
- U.S. oil production amounted to 13.1 million bpd for the week ended March 22, up 0.1 million bpd
from the prior week
-
Rig Count
- The total number of oil rigs amounted to 621, down 3 from last week
-
Inventories
-
Crude Oil
- Total U.S. crude oil inventories now amount to 448.2 million barrels, down (5.4%) YoY
- Refiners operated at a capacity utilization rate of 88.7% for the week, up from 87.8% in the prior week
- U.S. crude oil imports now amount to 6.278 million barrels per day, down 25.9% YoY
-
Gasoline
- Retail average regular gasoline prices amounted to $3.54 per gallon in the week of March 29,
up 1.0% YoY
- Gasoline prices on the East Coast amounted to $3.49, up 2.8% YoY
- Gasoline prices in the Midwest amounted to $3.48, up 5.1% YoY
- Gasoline prices on the Gulf Coast amounted to $3.27, up 3.2% YoY
- Gasoline prices in the Rocky Mountain region amounted to $3.41, down (6.8%) YoY
- Gasoline prices on the West Coast amounted to $4.59, down 2.2% YoY
- Motor gasoline inventories were down by 1.3 million barrels from the prior week
- Motor gasoline inventories amounted to 232.1 million barrels, up 2.4% YoY
- Production of motor gasoline averaged 9.21 million bpd, down (8.2%) YoY
- Demand for motor gasoline amounted to 8.715 million bpd, down (4.7%) YoY
-
Distillates
- Distillate inventories decreased by 1.2 million in the week of March 29
- Total distillate inventories amounted to 117.3 million barrels, up 0.6% YoY
- Distillate production averaged 4.814 million bpd, up 3.9% YoY
- Demand for distillates averaged 4.028 million bpd in the week, up 8.5% YoY
-
Natural Gas
- Natural gas inventories decreased by 36 billion cubic feet last week
- Total natural gas inventories now amount to 2,296 billion cubic feet, up 23.9% YoY
Credit News
High yield bond yields decreased 3bps to 7.55% and spreads increased 4bps to 322bps. Leveraged loan yields decreased 2bps to 9.30% and spreads increased 3bps to 509bps. WTD Leveraged loan returns were positive 12bps. WTD high yield bond returns were positive 10bps. For the week, market was relatively inactive due to the holiday shorten week.
High-yield:
Week ended 03/29/2024
- Yields & Spreads1
- Pricing & Returns1
- Fund Flows2
- New Issue2
- Distressed Level (trading in excess of 1,000 bps)2
- Total HY Defaults
1 Source: Credit Suisse High Yield and Leveraged Loan Index
2 Source: JP Morgan
Leveraged loans:
Week ended 03/29/2024
- Yields & Spreads1
- Leveraged Loan Index1
- Fund Flows2
- New Issue2
- Distressed Level (loan price below $80)1
- Total Loan Defaults
Default activity:
- Most recent defaults include: Robertshaw ($820mn, 2/29/24), Thrasio LLC ($724mn, 2/28/24), Hornblower ($838mn, 2/20/24), Careismatic ($700mn, 1/22/24), Enviva Partners ($750mn, 1/15/24), Ligado Networks ($4.2bn, 11/1/23), and Air Methods ($1.7bn, 10/24/23).
CLOs:
Week ended 03/29/2024
- New U.S. CLO Issuance2
- New U.S. CLO Issuance2
Note:High-yield and leveraged loan yields and spreads are swap-adjusted
1 Source: Credit Suisse High Yield and Leveraged Loan Index
2 Source: JP Morgan
Ratings activity:
- S&P and Moody’s High Yield Ratings
Appendix:
Diagram A: Leveraged Loan Trading Levels
Source: Credit Suisse Leveraged Loan Index
Diagram B: High Yield and Leveraged Loan LTM Price
Diagram C: Leveraged Loan and High Yield Returns
Diagram J: Leveraged Loan Defaults by Sector – Full Year
Diagram L: CLO Economics
Diagram N: Developed Country GovBond Yields (%)
Diagram O: S&P 500 Historical Multiples
Diagram P: U.S. Middle-Market M&A Valuations (EV/EBITDA)
Diagram Q: U.S. Large Cap M&A Valuations (EV/EBITDA
Diagram R: Dry Powder for All Private Equity Buyouts
Diagram S: Structured Credit Spreads
Diagram T: Structured Credit Yield
Diagram U: CAT Bonds – Cumulative Returns
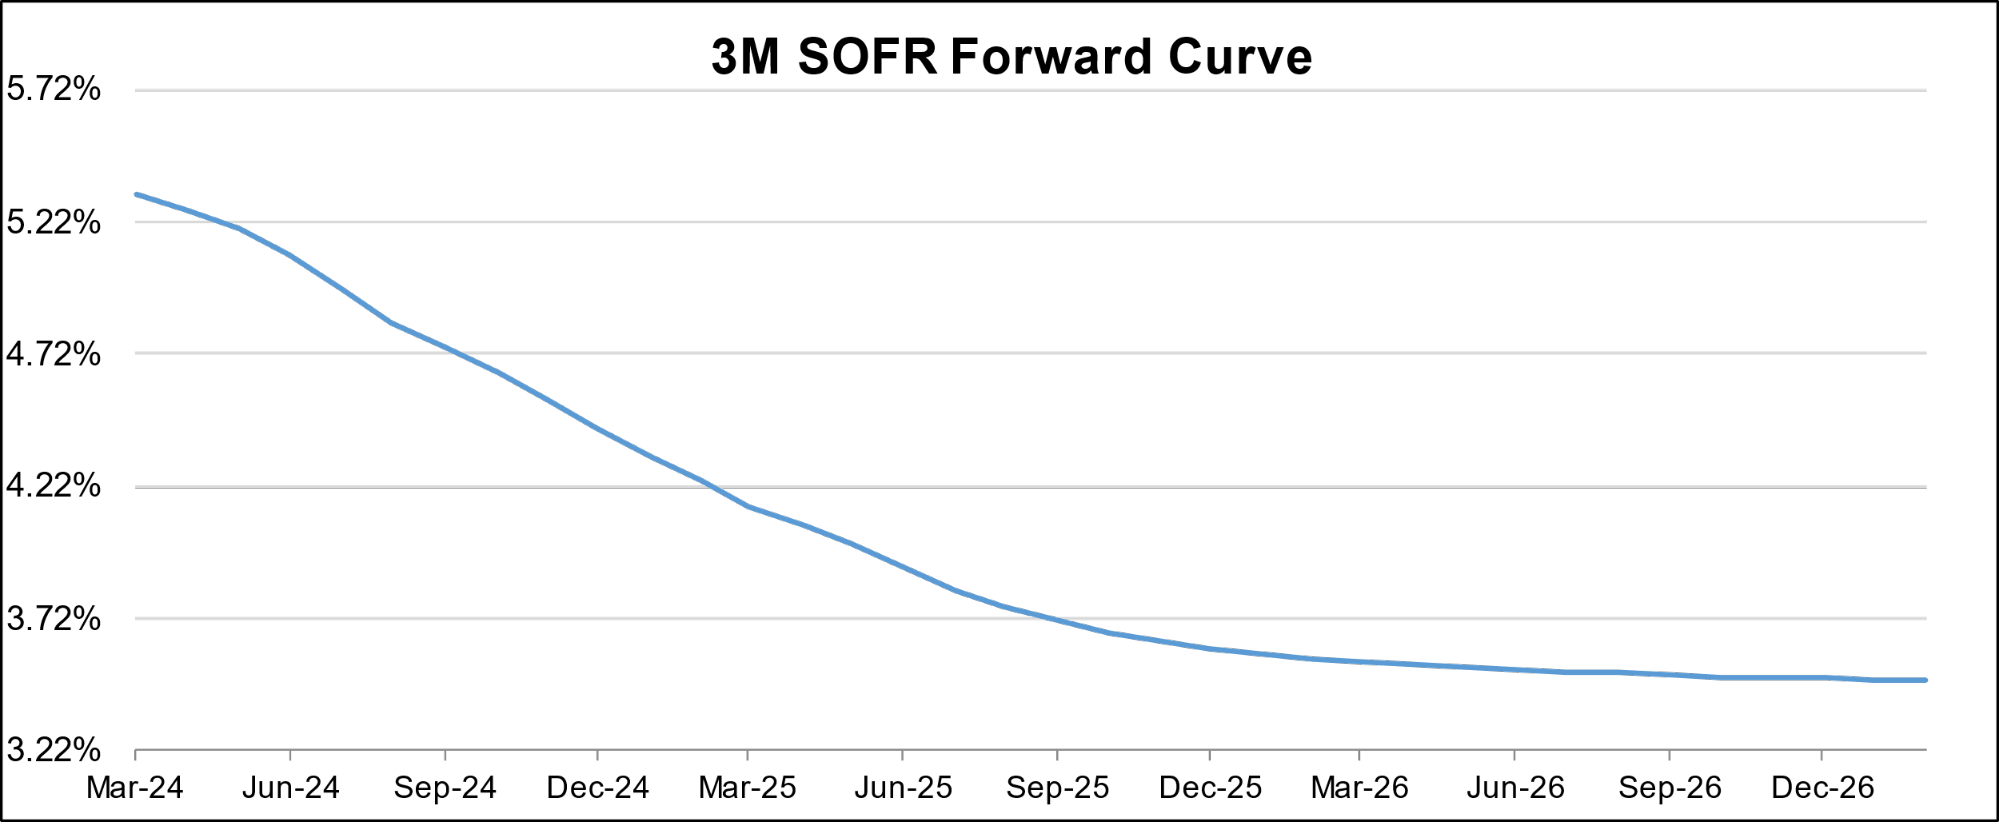
Diagram V: SOFR CURVE
Freight Rates
Drewry World Container Index
China-Global & Shanghai Export Container Freight Index
ZCGC RE Research: Shift in Homebuilders Strategy for New Single Family Build Outs
- Home builders are constructing smaller, more affordable homes with simpler amenities, responding to market demands for lower-cost housing options.
- The median price of new single-family houses dropped to $400,500 in February, the lowest since June 2021, reflecting a deliberate move to lower prices, which has included offering mortgage-rate buydowns among other incentives to attract buyers.
- There was a slight rise in sales, with new homes sold in February reaching 60,000, up 7.1% from the previous year, indicating that these strategies are drawing interest.
- This shift is a direct response to the oversupply in multifamily housing, oversupply of single family homes, there were 456,000 new houses for sale at all stages of construction translating into 7.8 months of supply, as well as the high mortgage rates, challenging single family builders to find innovative ways to maintain sales momentum.
