U.S. News
- Consumer Price Index
- Consumer prices rose a sharper than expected 0.3% in January, and the rate of inflation remained at 3.1% in January
- Core inflation rose 0.4% from the prior month, and the annual rate of core inflation was unchanged at 3.9%
- The bulk of the increase in CPI for January was due to an increase in the cost of rent and housing
- Imported Price Index
- The cost of imported goods jumped 0.8% in January, marking the first increase since last fall and the biggest rise in two years
- The higher cost of imported goods was fueled in part by rising gas prices, which increased 1.2% in January
- Excluding fuels and food, import prices rose 0.7% in January after being unchanged in December
- U.S. Retail Sales
- Retail sales fell 0.8% in January, marking the biggest drop in 10 months. Economists polled by the WSJ had forecasted a 0.2% gain
- Sales excluding automobiles fell 0.6% in January. Automobiles generally experience a larger decline January
- Sales of building materials and garden stores were especially weak, down 4.1%
- Jobless Claims
- Initial jobless claims, a measure of how many workers were laid off across the U.S., decreased to 212,000 in the week ended February 9, down 8,000 from the prior week
- The four-week moving average was 218,500, up 5750 from the prior week
- Continuing claims – those filed by workers unemployed for longer than a week – increased by 30,000 to 1.895 million in the week ended February 2. This figure is reported with a one-week lag
- Fed’s Balance Sheet
- The Federal Reserve’s assets totaled $7.634 trillion in the week ended February 16, up $2.6 billion from the prior week
- Treasury holdings totaled $4.693 trillion, down $0.1 billion from the prior week
- Holdings of mortgage-backed securities (MBS) were $2.42 trillion in the week, up $0.0 billion from the prior week
- Total Public Debt
- Total public debt outstanding was $34.25 trillion as of February 16, an increase of 8.9% from the previous year
- Debt held by the public was $24.63 trillion, and intragovernmental holdings were $7.12 trillion
- Inflation Factors
- CPI:
- The consumer-price index rose 3.1% in December year over year
- On a monthly basis, the CPI increased 0.3% in January on a seasonally adjusted basis, after increasing 0.2% in November
- The index for all items less food and energy (core CPI) rose 0.4% in January, after rising 0.3% in December
- Core CPI increased 3.9% for the 12 months ending January
- Food and Beverages:
- The food at home index increased 1.2% i n January from the same month a year earlier, and increased 0.4% in January month over month
- The food away from home index increased 5.1% in January from the same month a year earlier, and increased 0.5% in January month over month
- Commodities:
- The energy commodities index decreased (3.2%) in January after decreasing
- The energy commodities index fell (6.8%) over the last 12 months
- The energy services index 2.5% in January after increasing 0.4% in December
- The energy services index fell (2.0%) over the last 12 months
- The gasoline index fell (6.4%) over the last 12 months
- The fuel oil index fell (14.2%) over the last 12 months
- The index for electricity rose 3.8% over the last 12 months
- The index for natural gas fell (17.8%) over the last 12 months
- Supply Chain:
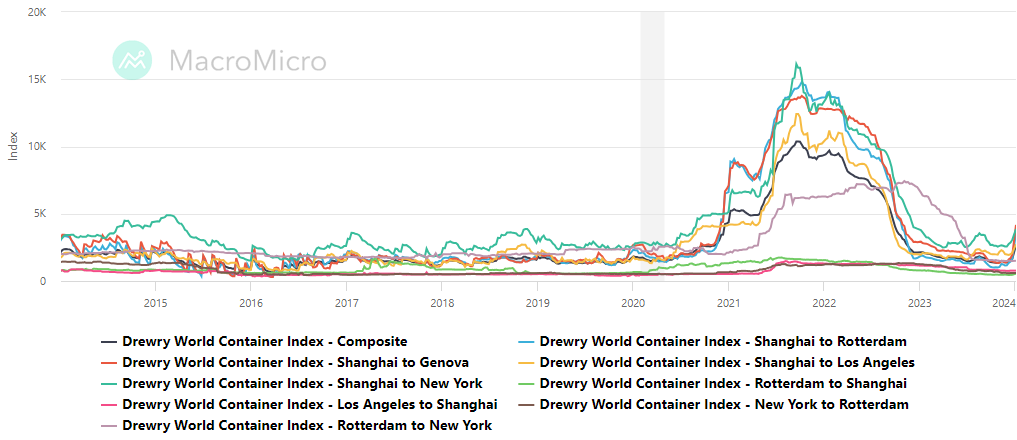
- Drewry’s composite World Container Index decreased to $3,732.70 per 40ft container
- Drewry’s composite World Container Index has increased by 91.0% over the last 12 months
- Housing Market:
- The shelter index increased 0.6% in January after increasing 0.4% in December
- The rent index increased 0.4% in January after increasing 0.4% in December
- The index for lodging away from home increased 4.3% in January after decreasing (1.1%) in December
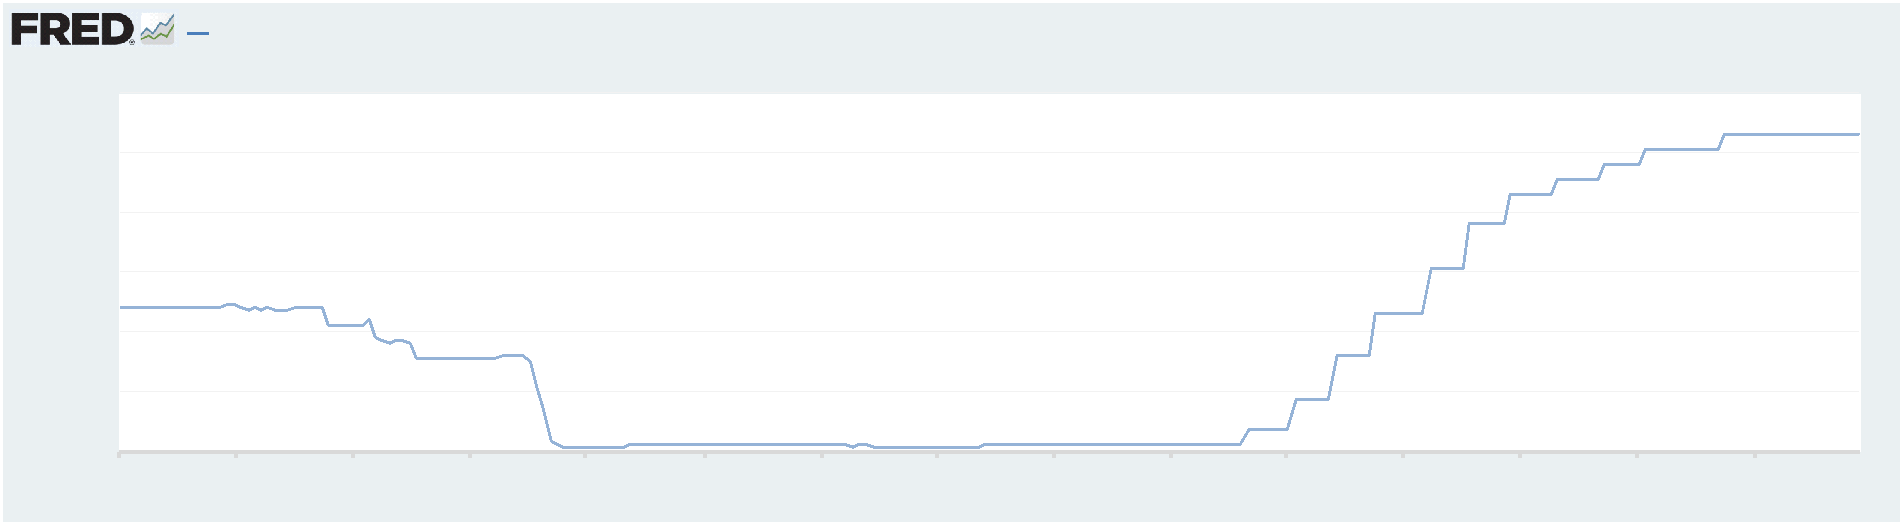
- Fed Funds Rate
- The effective Federal Funds Rate is at 5.33%, flat 0.00% year to date
World News
-
Egpyt
- Egyptian authorities are building an eight-mile walled enclosure in the Sinai Desert near the border. The enclosure will be used for a possible flood of refugees from Gaza before Israel’s imminent military push into Rafah
- More than 100,000 people could be accommodated in the camp, according to Egyptian officials. The camp is set to have a large number of tents to house Gaza refugees
-
Russia
- The White House has confirmed that Russia is pursuing an “antisatellite capability.” The nuclear weapon would theoretically be able to destroy satellites and damage national infrastructure
- The weapon would be space-based, and it would violate the Outer Space Treaty, which is signed by more than 130 countries, including Russia
-
Ukraine
- France and Germany lined up long-term military aid pacts with Ukraine on Friday as the Biden administration struggles to push its own assistance through congress
- The U.S. has a $95 billion foreign-aid package that includes funding for Ukraine, Israel and Taiwan that recently passed the Senate but is unlikely to get a vote in the House of Representatives
-
China
- Xi Jinping wants to revive socialist ideas about housing to combat the nation’s real estate crisis. Under the new strategy, the Communist Party would take over a larger share of the housing market
- One initiative involves the state buying up distressed private-market projects and converting them into homes that the government would rent out or sell. The other initiative would have the government build more subsidized housing for low and middle-income families
- The end goal is to increase the share of housing built by the state for low-cost rental or sale under restricted conditions to at least 30% of China’s housing stock, which is currently 5% today
- According to analysts, the estimated costs could be up to $280 billion a year for the next five years ($1.4 trillion total)
-
Japan
- Japan dropped a rank to become the world’s fourth largest economy after a weak end to 2023, as growth in tourism spending failed to offset sluggishness in domestic private consumption and capital spending
-
Brazil
- Brazilian Federal Police seized the passport of former President Jair Bolsonaro and arrested four of his close allies as authorities narrowed in on the conservative and his aides over allegations that they plotted a military takeover as early as late-2022
-
Nicaragua
- Nicaragua’s authoritarian government, which has expelled religious leaders, political opponents and journalists, has granted asylum to a former Panamanian president convicted of money laundering, the third former leader from the region to find refuge in Managua
-
Argentina
- Argentina’s Chamber of Deputies on Friday approved in general terms a reform bill proposed by libertarian President Javier Milei to deregulate the economy, overcoming a hurdle for the sweeping initiative after three days of heated debate
-
Sweden
- Hungarian Prime Minister Viktor Orban escalated a standoff with Western allies over Sweden’s NATO accession after a senior US lawmaker called for potential sanctions against the lone holdout
-
Canada
- Prime Minister Justin Trudeau has confirmed that his government is considering imposing sanctions on Israeli settlers in the West Bank
-
Ecuador
- Ecuador is at war with drug gangs, President Daniel Noboa said, as troops patrolled the country’s largest city, Guayaquil, a day after gunmen took over a TV studio and launched a series of attacks against the Andean nation’s new government
Commodities
-
Oil Prices
- WTI: $79.15 per barrel
- +3.01% WoW; +10.47% YTD; +0.84% YoY
- Brent: $83.28 per barrel
- +1.33% WoW; +8.10% YTD; (2.18%) YoY
-
US Production
- U.S. oil production amounted to 13.3 million bpd for the week ended February 9, down 0.3 million bpd
from the prior week
-
Rig Count
- The total number of oil rigs amounted to 621, down 2 from last week
-
Inventories
-
Crude Oil
- Total U.S. crude oil inventories now amount to 439.5 million barrels, down (6.8%) YoY
- Refiners operated at a capacity utilization rate of 80.6% for the week, down from 82.4% in the prior week
- U.S. crude oil imports now amount to 6.907 million barrels per day, down (3.8%) YoY
-
Gasoline
- Retail average regular gasoline prices amounted to $3.28 per gallon in the week of February 16,
down (4.0%) YoY
- Gasoline prices on the East Coast amounted to $3.26, down (5.2%) YoY
- Gasoline prices in the Midwest amounted to $3.12, down (5.7%) YoY
- Gasoline prices on the Gulf Coast amounted to $2.91, down (6.5%) YoY
- Gasoline prices in the Rocky Mountain region amounted to $2.91, down (25.2%) YoY
- Gasoline prices on the West Coast amounted to $4.15, down (2.0%) YoY
- Motor gasoline inventories were down by 3.7 million barrels from the prior week
- Motor gasoline inventories amounted to 247.3 million barrels, up 2.2% YoY
- Production of motor gasoline averaged 9.18 million bpd, up 0.9% YoY
- Demand for motor gasoline amounted to 8.168 million bpd, down (1.3%) YoY
-
Distillates
- Distillate inventories decreased by -1.9 million in the week of February 16
- Total distillate inventories amounted to 125.7 million barrels, up 5.4% YoY
- Distillate production averaged 4.076 million bpd, down (9.6%) YoY
- Demand for distillates averaged 3.514 million bpd in the week, down (9.8%) YoY
-
Natural Gas
- Natural gas inventories decreased by 49 billion cubic feet last week
- Total natural gas inventories now amount to 2,535 billion cubic feet, up 11.9% YoY
Credit News
High yield bond yields increased 7bps to 7.82% and spreads decreased 2bps to 347bps. Leveraged loan yields increased 14bps to 9.42% and spreads decreased 1bps to 526bps. WTD Leveraged loan returns were positive 19bps. WTD high yield bond returns were negative 12bps. For the week, credit markets reacted in a mixed manner to stronger than expected CPI and PPI data. Floating rate loans outperformed fixed coupon bonds. 10yr treasury yields were 11bps higher on week.
High-yield:
Week ended 02/16/2024
- Yields & Spreads1

- Pricing & Returns1

- Fund Flows2

- New Issue2

- Distressed Level (trading in excess of 1,000 bps)2

- Total HY Defaults

1 Source: Credit Suisse High Yield and Leveraged Loan Index
2 Source: JP Morgan
Leveraged loans:
Week ended 02/16/2024
- Yields & Spreads1

- Leveraged Loan Index1

- Fund Flows2

- New Issue2

- Distressed Level (loan price below $80)1

- Total Loan Defaults

Default activity:
- Most recent defaults include: Enviva Partners ($750mn, 1/15/24, Mobileum ($538mm, 12/1/23) Ligado Networks ($4.2bn, 11/1/23), Air Methods ($1.7bn, 10/24/23), WeWork ($1.6bn, 10/15/23), Rite Aid ($3.0bn 10/16/23)
CLOs:
Week ended 02/16/2024
- New U.S. CLO Issuance2

- New U.S. CLO Issuance2

Note:High-yield and leveraged loan yields and spreads are swap-adjusted
1 Source: Credit Suisse High Yield and Leveraged Loan Index
2 Source: JP Morgan
Ratings activity:
- S&P and Moody’s High Yield Ratings

Appendix:
Diagram A: Leveraged Loan Trading Levels
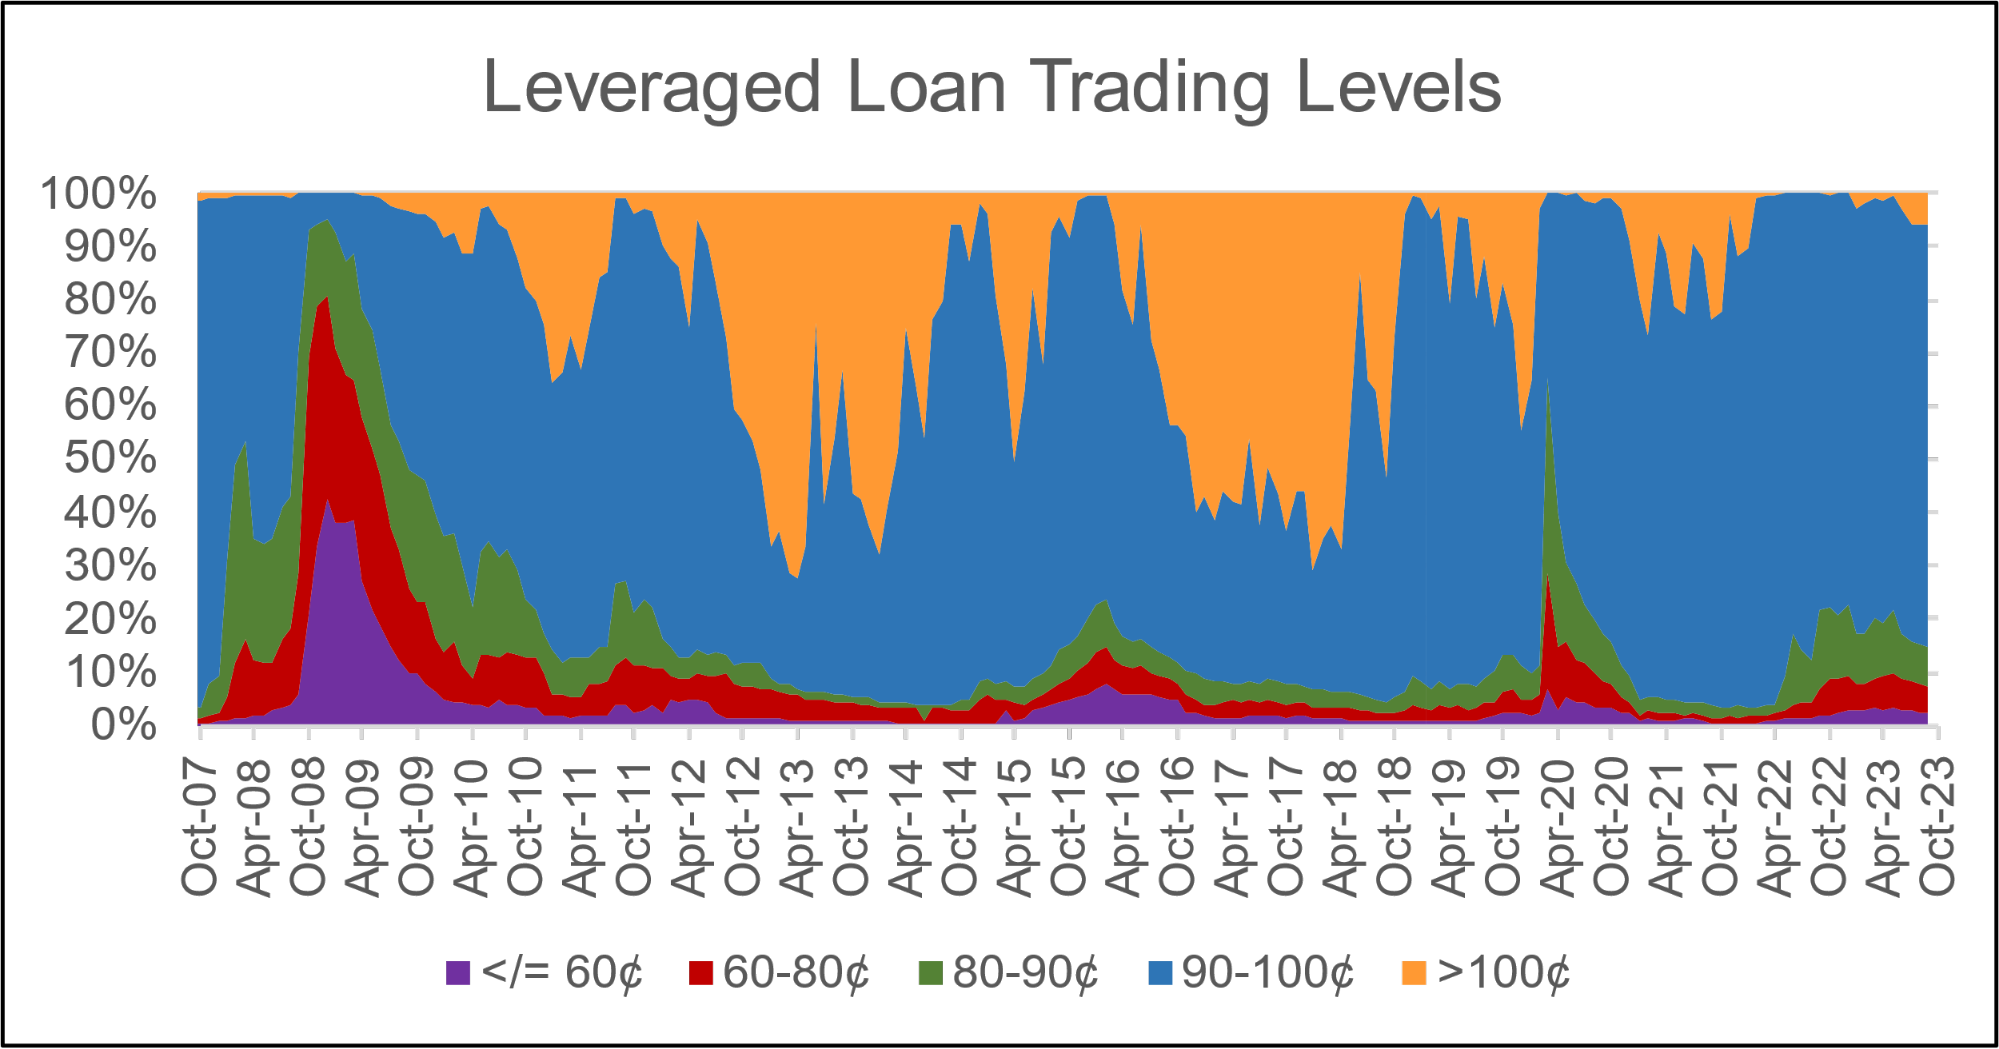
Source: Credit Suisse Leveraged Loan Index
Diagram B: High Yield and Leveraged Loan LTM Price

Diagram C: Leveraged Loan and High Yield Returns


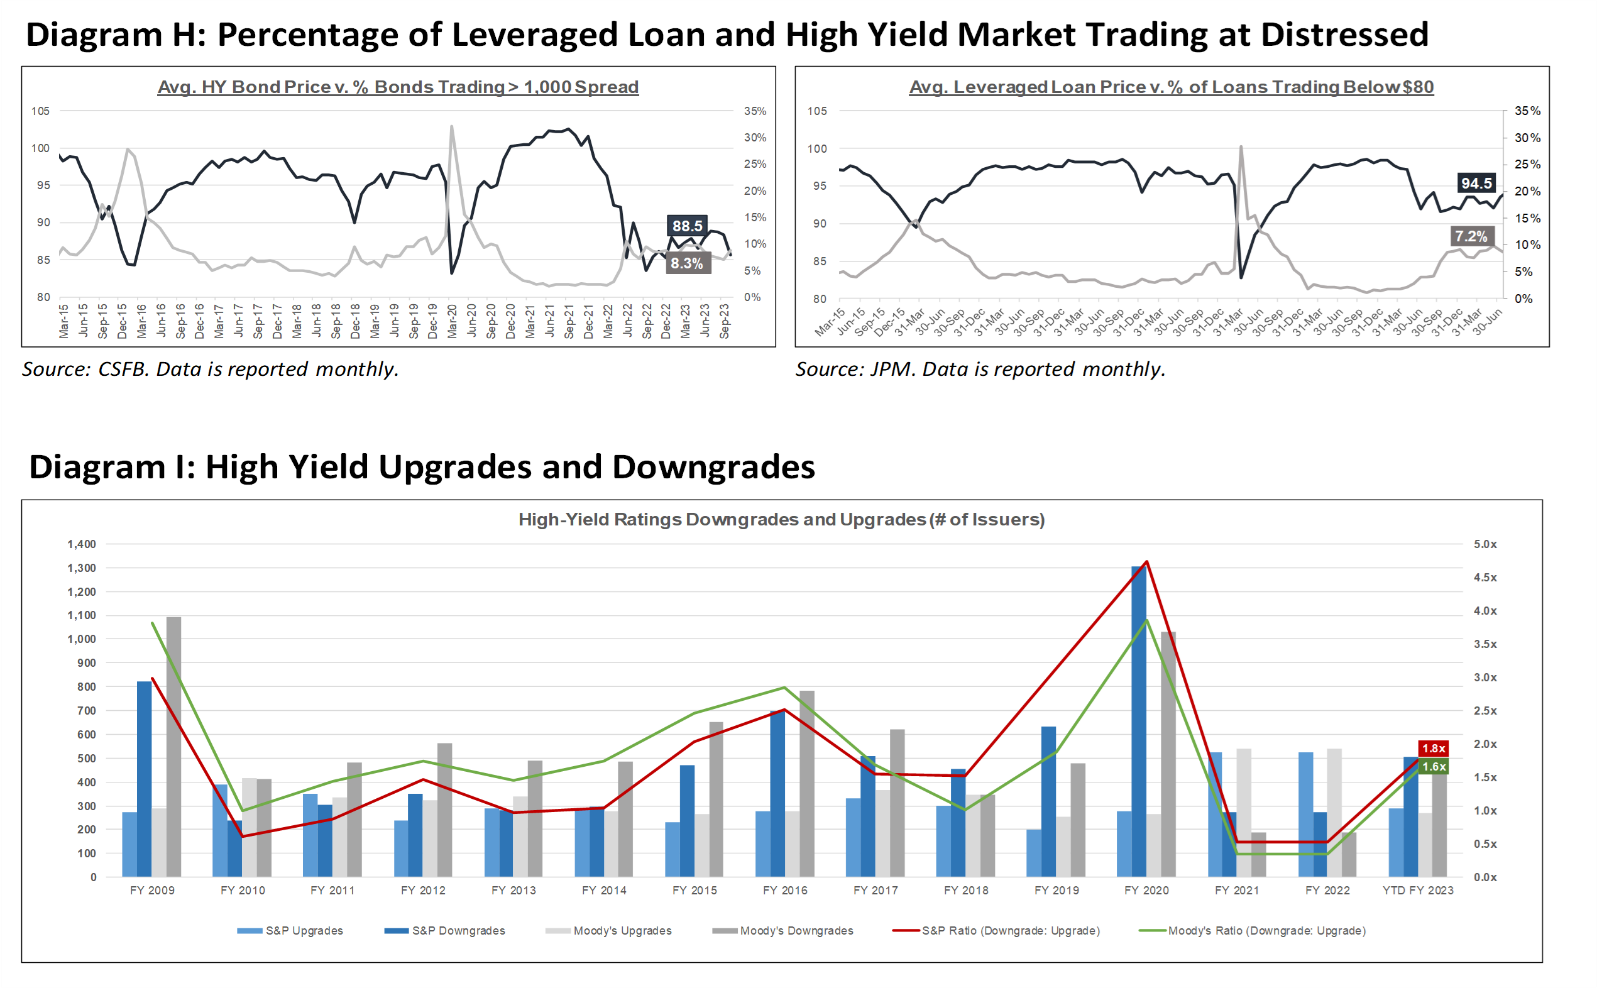
Diagram J: Leveraged Loan Defaults by Sector – Full Year
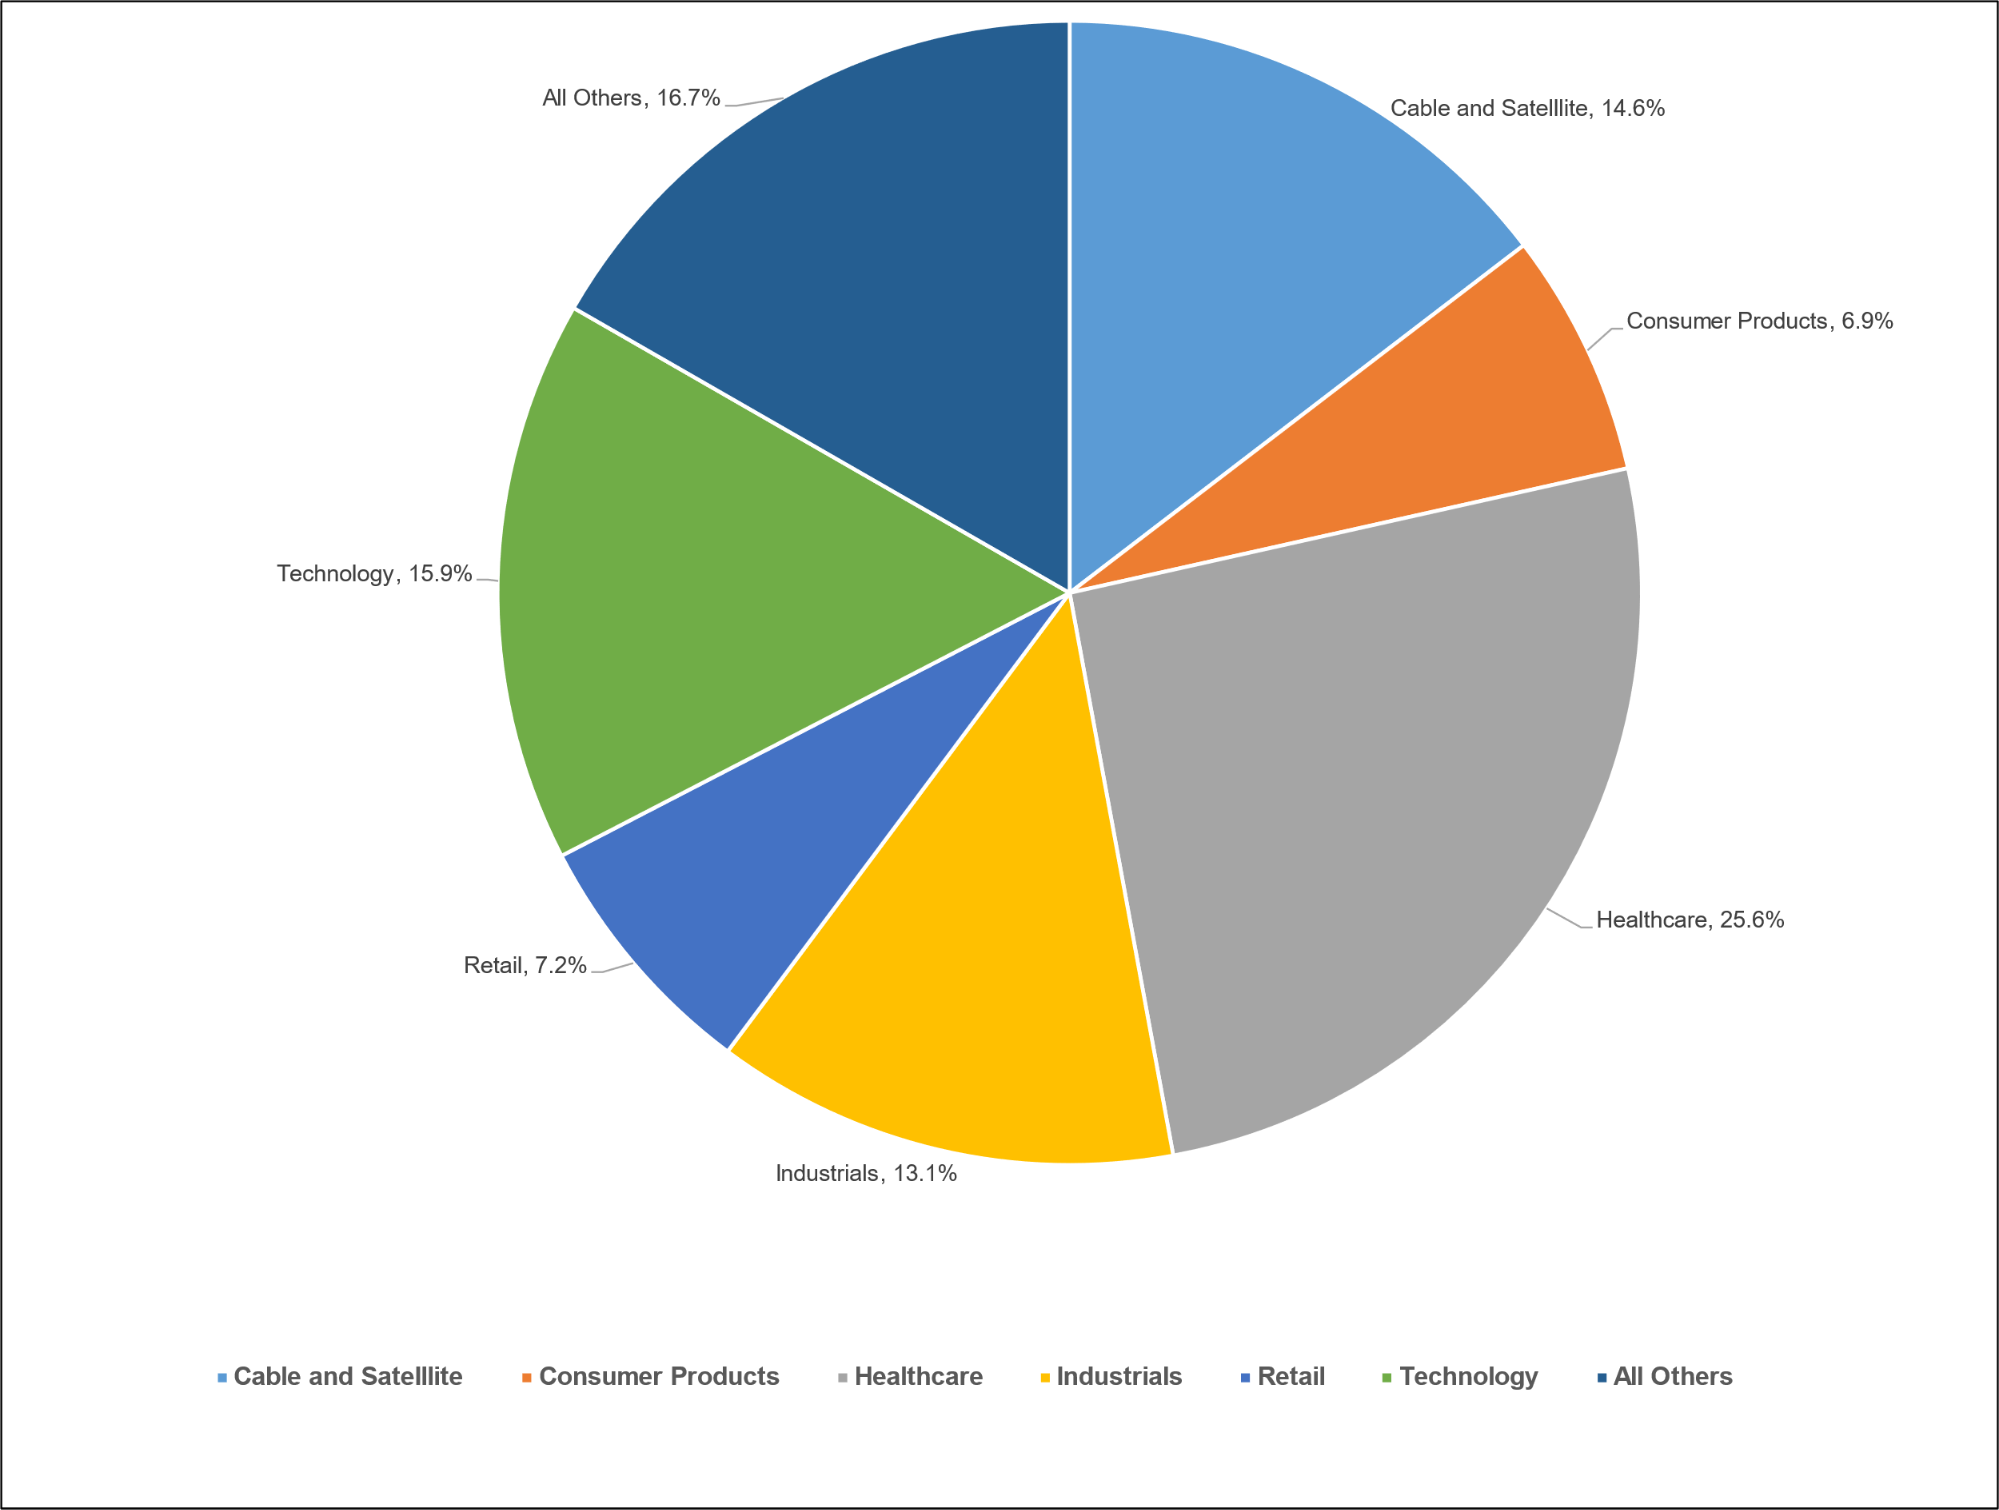
Diagram L: CLO Economics
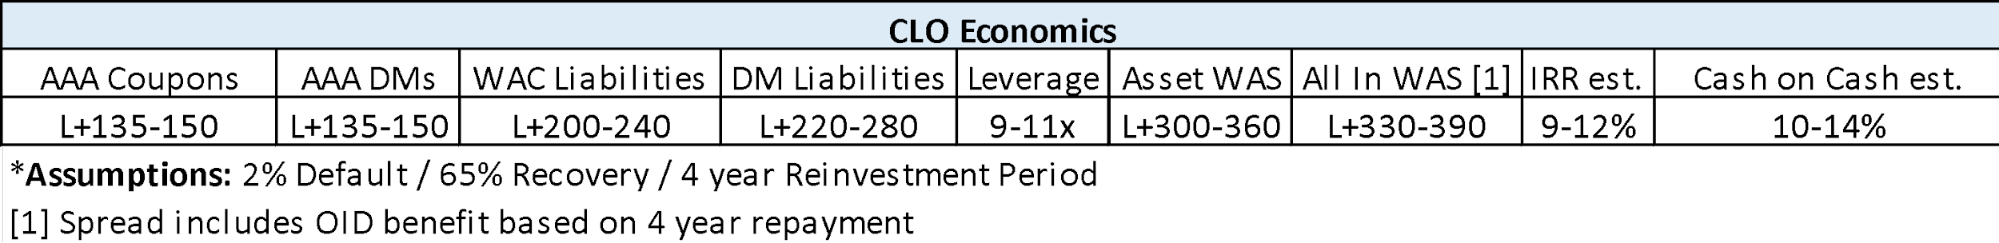
Diagram N: Developed Country GovBond Yields (%)

Diagram O: S&P 500 Historical Multiples
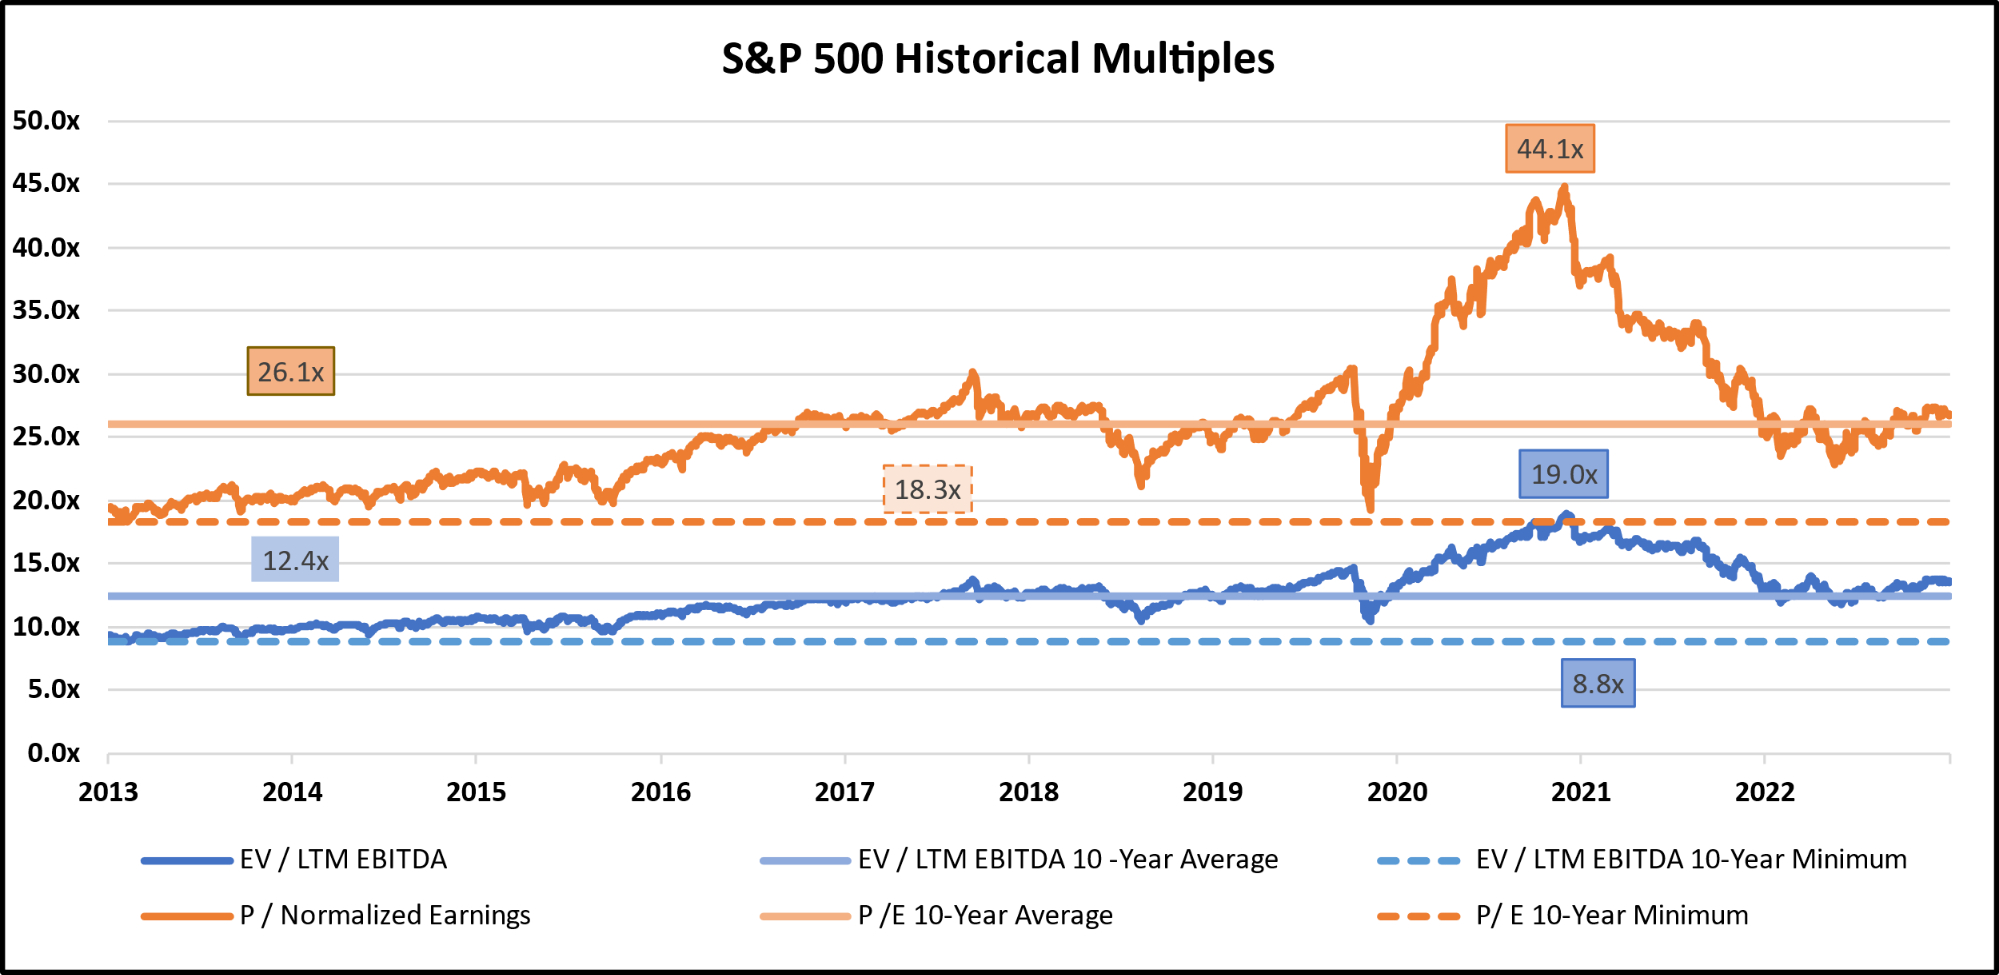
Diagram P: U.S. Middle-Market M&A Valuations (EV/EBITDA)
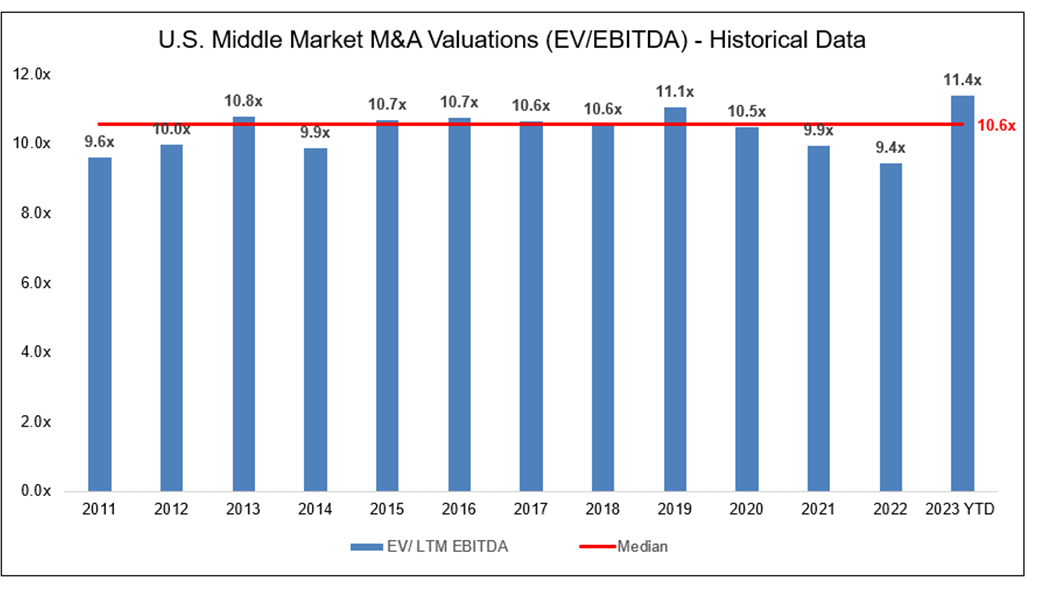
Diagram Q: U.S. Large Cap M&A Valuations (EV/EBITDA
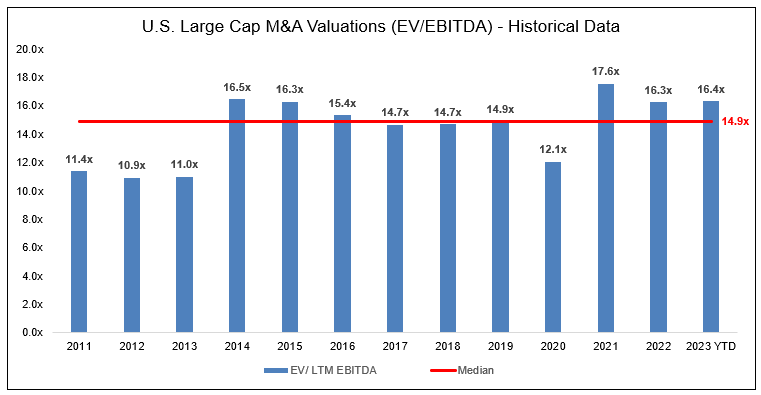
Diagram R: Dry Powder for All Private Equity Buyouts

Diagram S: Structured Credit Spreads
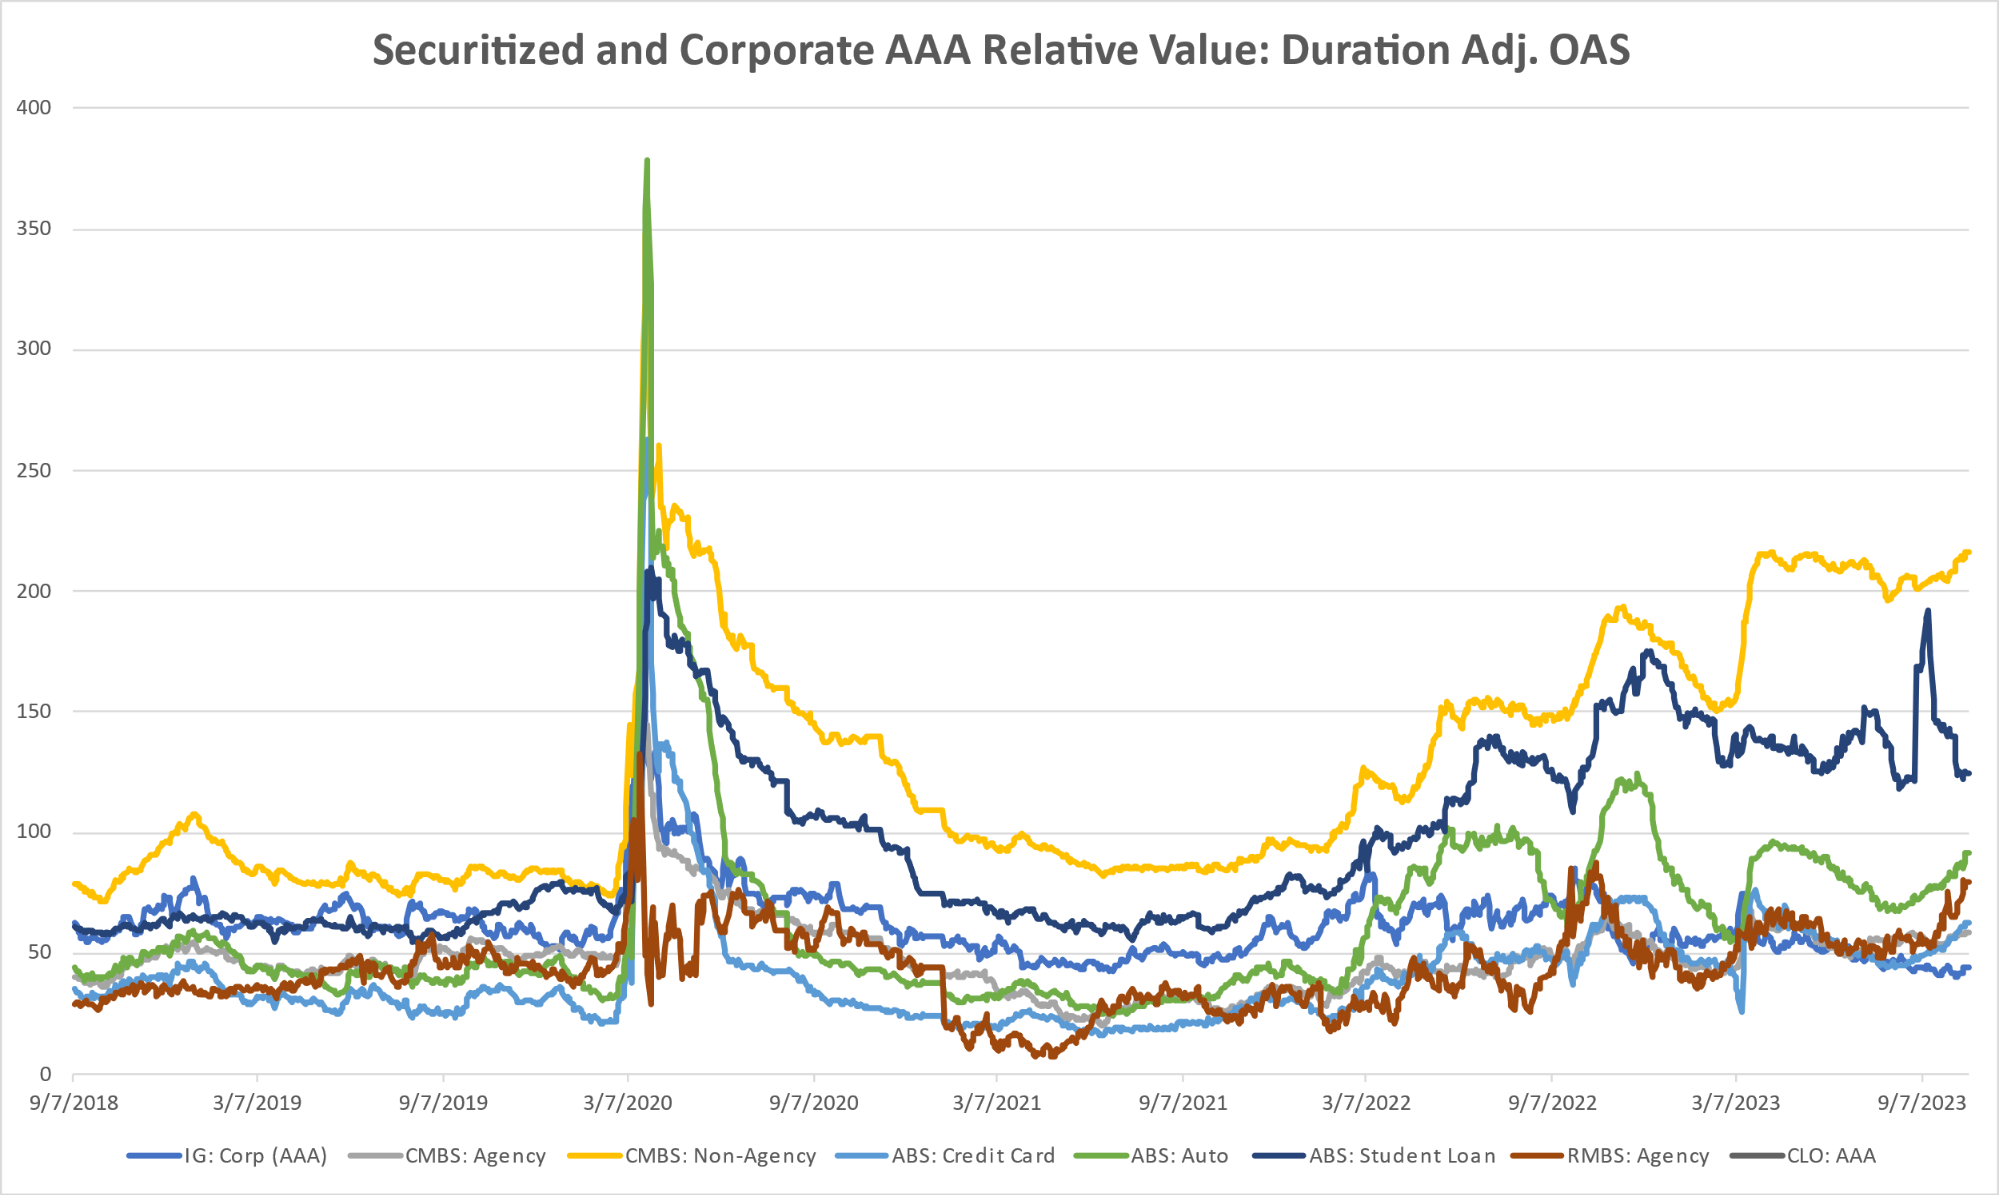
Diagram T: Structured Credit Yield
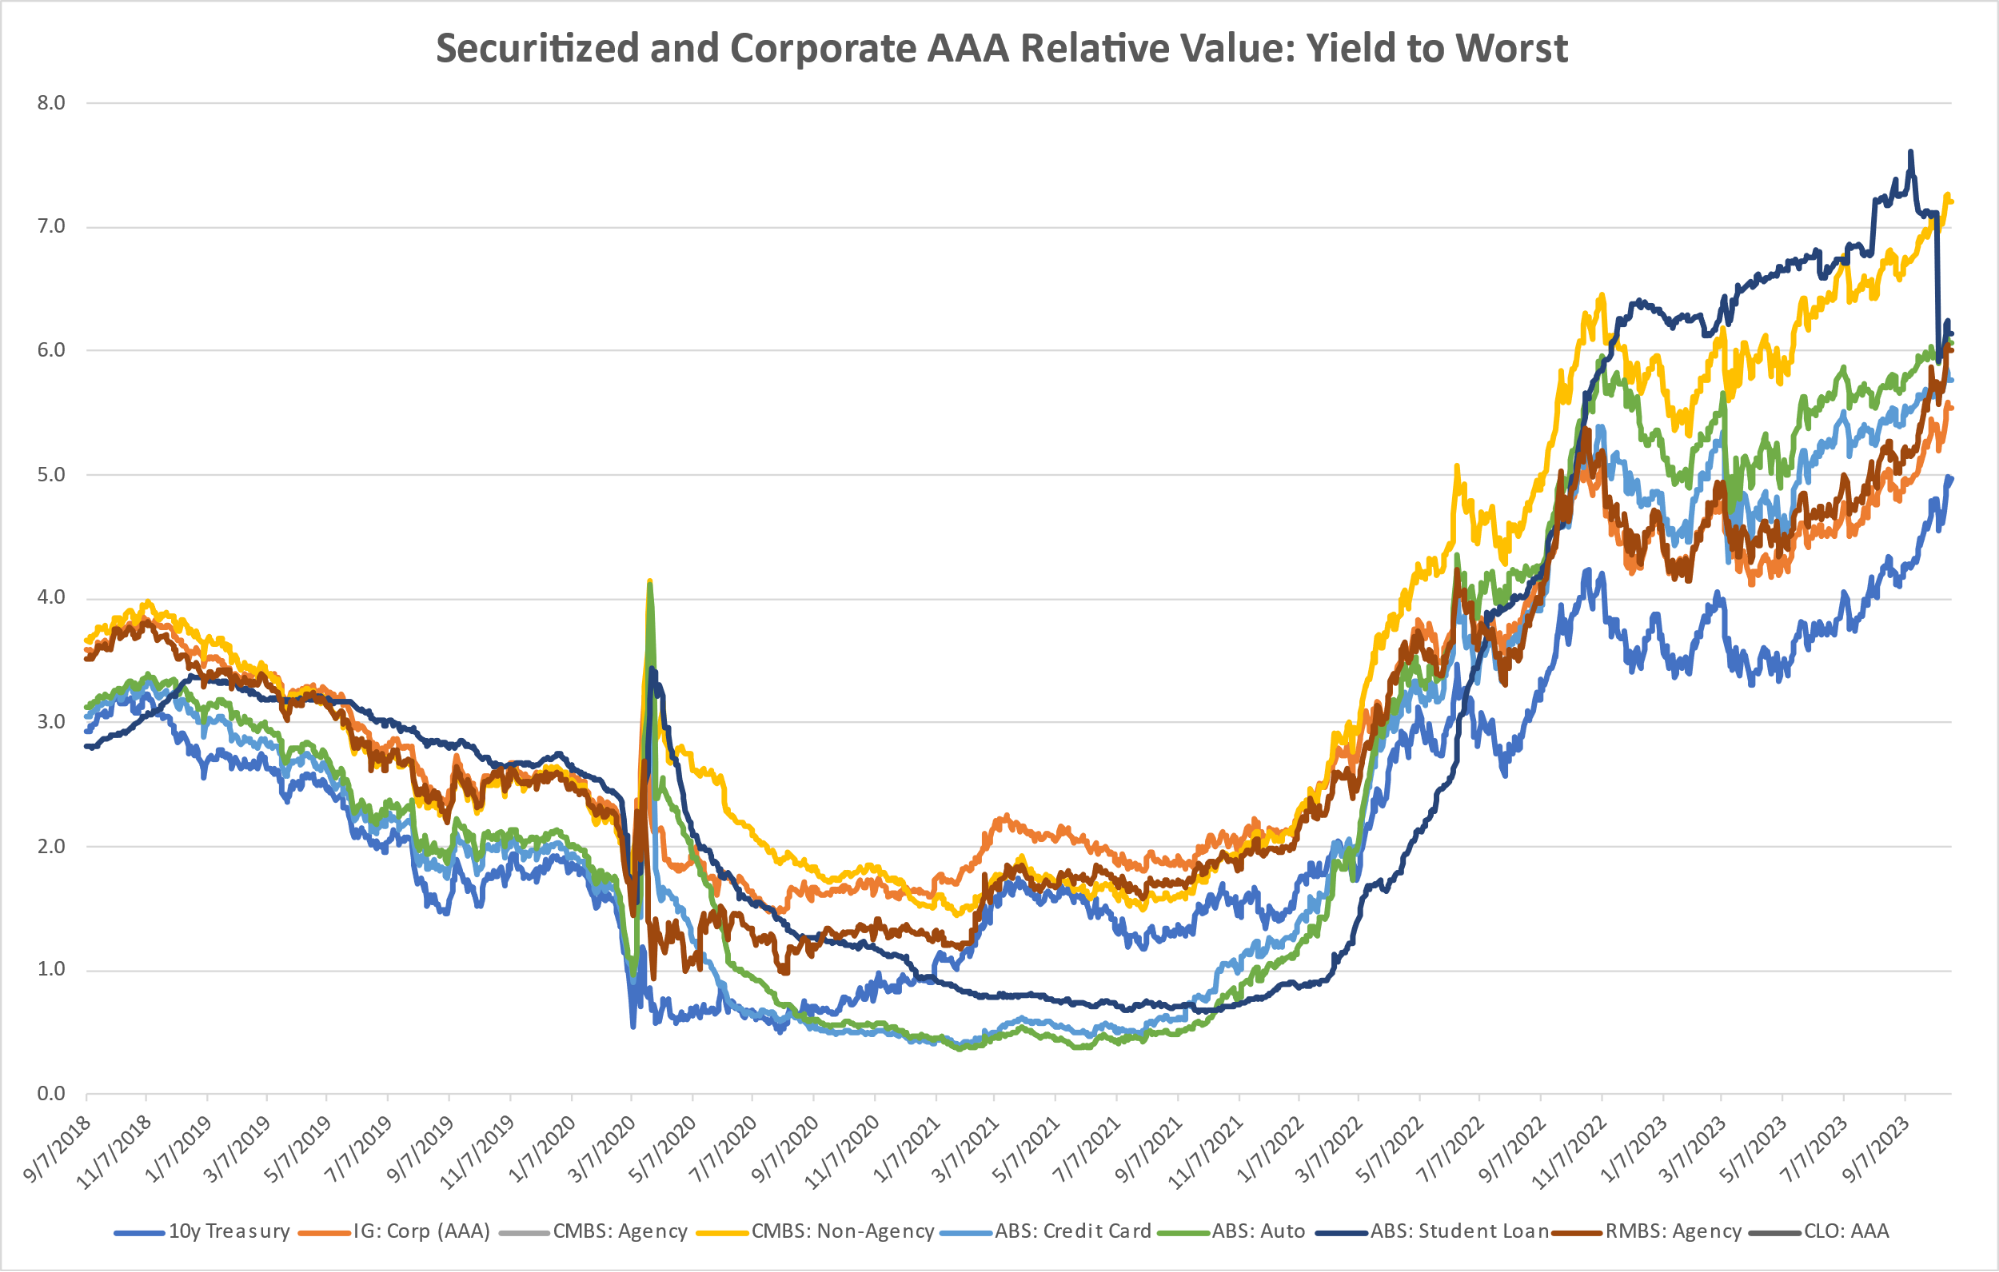
Diagram U: CAT Bonds – Cumulative Returns
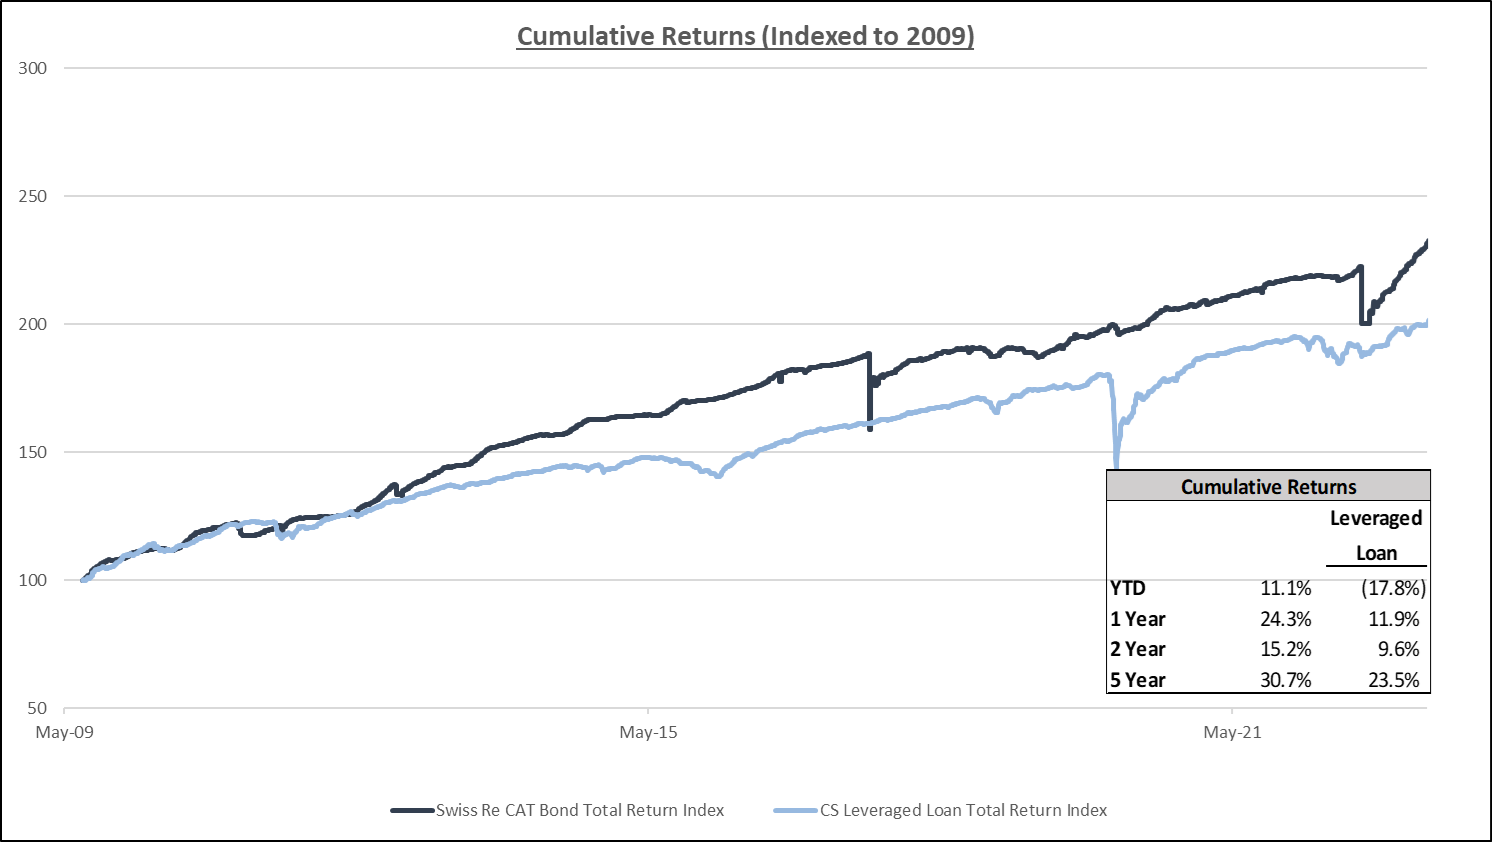
Diagram V: SOFR CURVE

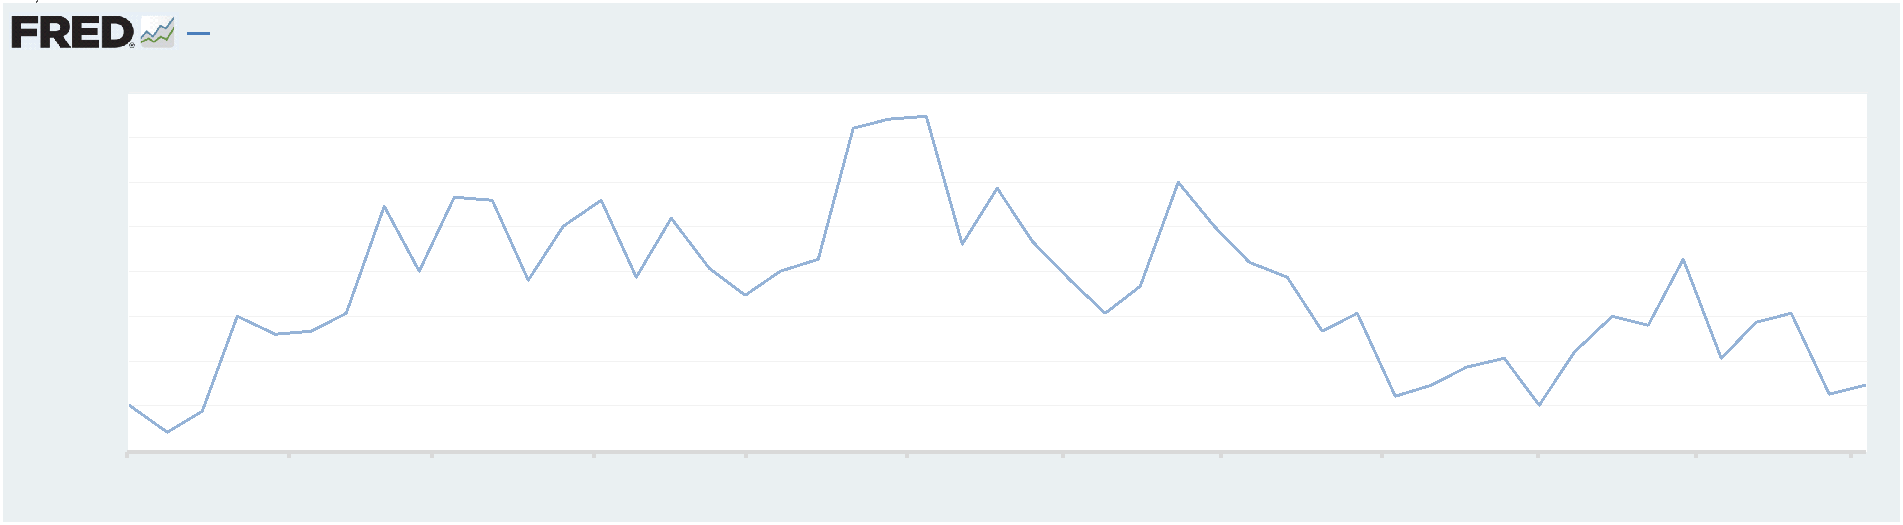
Freight Rates
Drewry World Container Index
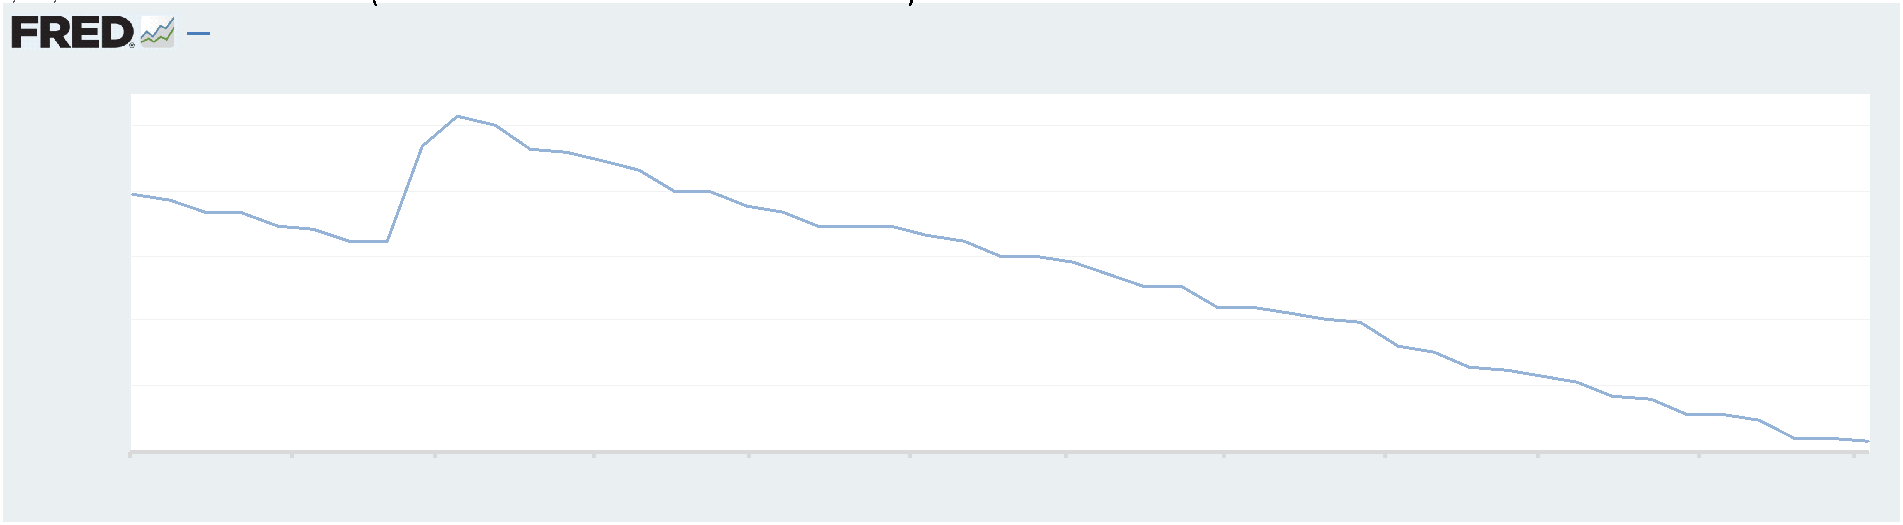
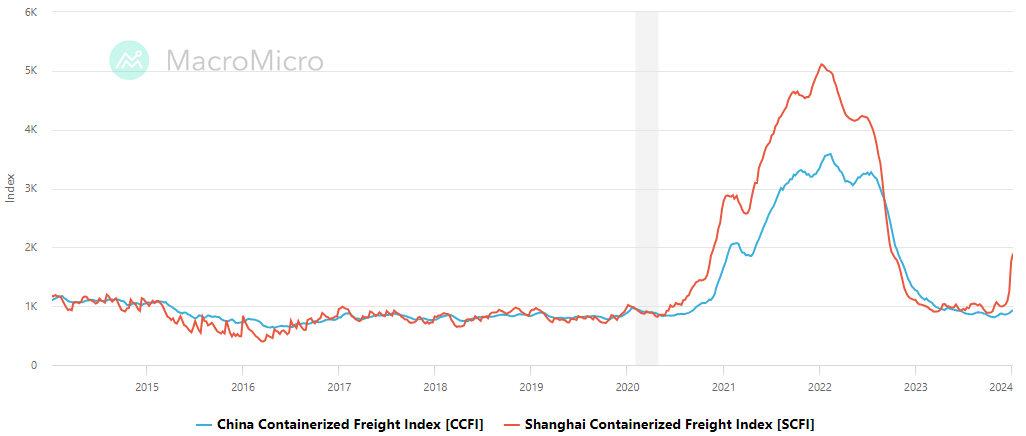
China-Global & Shanghai Export Container Freight Index
U.S. News
- Consumer Price Index
- Consumer prices rose a sharper than expected 0.3% in January, and the rate of inflation remained at 3.1% in January
- Core inflation rose 0.4% from the prior month, and the annual rate of core inflation was unchanged at 3.9%
- The bulk of the increase in CPI for January was due to an increase in the cost of rent and housing
- Imported Price Index
- The cost of imported goods jumped 0.8% in January, marking the first increase since last fall and the biggest rise in two years
- The higher cost of imported goods was fueled in part by rising gas prices, which increased 1.2% in January
- Excluding fuels and food, import prices rose 0.7% in January after being unchanged in December
- U.S. Retail Sales
- Retail sales fell 0.8% in January, marking the biggest drop in 10 months. Economists polled by the WSJ had forecasted a 0.2% gain
- Sales excluding automobiles fell 0.6% in January. Automobiles generally experience a larger decline January
- Sales of building materials and garden stores were especially weak, down 4.1%
- Jobless Claims
- Initial jobless claims, a measure of how many workers were laid off across the U.S., decreased to 212,000 in the week ended February 9, down 8,000 from the prior week
- The four-week moving average was 218,500, up 5750 from the prior week
- Continuing claims – those filed by workers unemployed for longer than a week – increased by 30,000 to 1.895 million in the week ended February 2. This figure is reported with a one-week lag
- Fed’s Balance Sheet
- The Federal Reserve’s assets totaled $7.634 trillion in the week ended February 16, up $2.6 billion from the prior week
- Treasury holdings totaled $4.693 trillion, down $0.1 billion from the prior week
- Holdings of mortgage-backed securities (MBS) were $2.42 trillion in the week, up $0.0 billion from the prior week
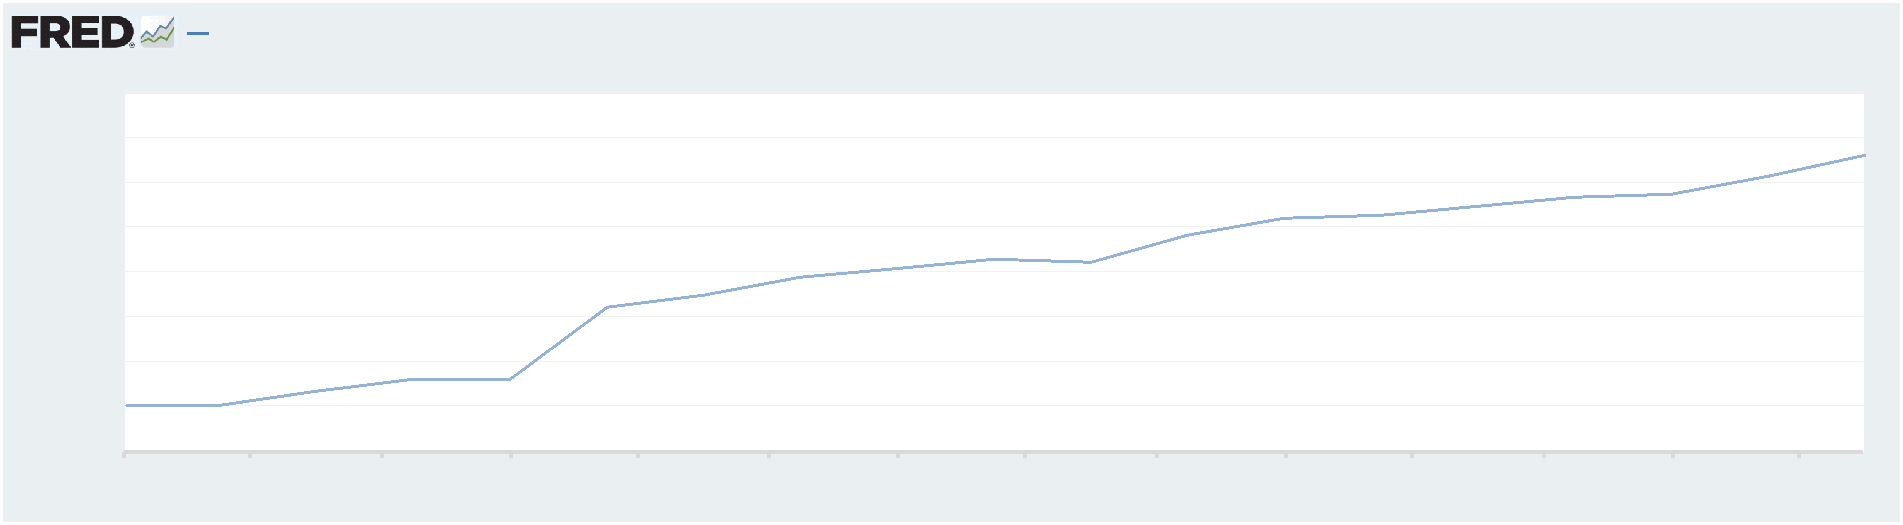
- Total Public Debt
- Total public debt outstanding was $34.25 trillion as of February 16, an increase of 8.9% from the previous year
- Debt held by the public was $24.63 trillion, and intragovernmental holdings were $7.12 trillion
- Inflation Factors
- CPI:
- The consumer-price index rose 3.1% in December year over year
- On a monthly basis, the CPI increased 0.3% in January on a seasonally adjusted basis, after increasing 0.2% in November
- The index for all items less food and energy (core CPI) rose 0.4% in January, after rising 0.3% in December
- Core CPI increased 3.9% for the 12 months ending January
- Food and Beverages:
- The food at home index increased 1.2% i n January from the same month a year earlier, and increased 0.4% in January month over month
- The food away from home index increased 5.1% in January from the same month a year earlier, and increased 0.5% in January month over month
- Commodities:
- The energy commodities index decreased (3.2%) in January after decreasing
- The energy commodities index fell (6.8%) over the last 12 months
- The energy services index 2.5% in January after increasing 0.4% in December
- The energy services index fell (2.0%) over the last 12 months
- The gasoline index fell (6.4%) over the last 12 months
- The fuel oil index fell (14.2%) over the last 12 months
- The index for electricity rose 3.8% over the last 12 months
- The index for natural gas fell (17.8%) over the last 12 months
- Supply Chain:
- Drewry’s composite World Container Index decreased to $3,732.70 per 40ft container
- Drewry’s composite World Container Index has increased by 91.0% over the last 12 months
- Housing Market:
- The shelter index increased 0.6% in January after increasing 0.4% in December
- The rent index increased 0.4% in January after increasing 0.4% in December
- The index for lodging away from home increased 4.3% in January after decreasing (1.1%) in December
- Fed Funds Rate
- The effective Federal Funds Rate is at 5.33%, flat 0.00% year to date
World News
-
Egpyt
- Egyptian authorities are building an eight-mile walled enclosure in the Sinai Desert near the border. The enclosure will be used for a possible flood of refugees from Gaza before Israel’s imminent military push into Rafah
- More than 100,000 people could be accommodated in the camp, according to Egyptian officials. The camp is set to have a large number of tents to house Gaza refugees
-
Russia
- The White House has confirmed that Russia is pursuing an “antisatellite capability.” The nuclear weapon would theoretically be able to destroy satellites and damage national infrastructure
- The weapon would be space-based, and it would violate the Outer Space Treaty, which is signed by more than 130 countries, including Russia
-
Ukraine
- France and Germany lined up long-term military aid pacts with Ukraine on Friday as the Biden administration struggles to push its own assistance through congress
- The U.S. has a $95 billion foreign-aid package that includes funding for Ukraine, Israel and Taiwan that recently passed the Senate but is unlikely to get a vote in the House of Representatives
-
China
- Xi Jinping wants to revive socialist ideas about housing to combat the nation’s real estate crisis. Under the new strategy, the Communist Party would take over a larger share of the housing market
- One initiative involves the state buying up distressed private-market projects and converting them into homes that the government would rent out or sell. The other initiative would have the government build more subsidized housing for low and middle-income families
- The end goal is to increase the share of housing built by the state for low-cost rental or sale under restricted conditions to at least 30% of China’s housing stock, which is currently 5% today
- According to analysts, the estimated costs could be up to $280 billion a year for the next five years ($1.4 trillion total)
-
Japan
- Japan dropped a rank to become the world’s fourth largest economy after a weak end to 2023, as growth in tourism spending failed to offset sluggishness in domestic private consumption and capital spending
-
Brazil
- Brazilian Federal Police seized the passport of former President Jair Bolsonaro and arrested four of his close allies as authorities narrowed in on the conservative and his aides over allegations that they plotted a military takeover as early as late-2022
-
Nicaragua
- Nicaragua’s authoritarian government, which has expelled religious leaders, political opponents and journalists, has granted asylum to a former Panamanian president convicted of money laundering, the third former leader from the region to find refuge in Managua
-
Argentina
- Argentina’s Chamber of Deputies on Friday approved in general terms a reform bill proposed by libertarian President Javier Milei to deregulate the economy, overcoming a hurdle for the sweeping initiative after three days of heated debate
-
Sweden
- Hungarian Prime Minister Viktor Orban escalated a standoff with Western allies over Sweden’s NATO accession after a senior US lawmaker called for potential sanctions against the lone holdout
-
Canada
- Prime Minister Justin Trudeau has confirmed that his government is considering imposing sanctions on Israeli settlers in the West Bank
-
Ecuador
- Ecuador is at war with drug gangs, President Daniel Noboa said, as troops patrolled the country’s largest city, Guayaquil, a day after gunmen took over a TV studio and launched a series of attacks against the Andean nation’s new government
Commodities
-
Oil Prices
- WTI: $79.15 per barrel
- +3.01% WoW; +10.47% YTD; +0.84% YoY
- Brent: $83.28 per barrel
- +1.33% WoW; +8.10% YTD; (2.18%) YoY
-
US Production
- U.S. oil production amounted to 13.3 million bpd for the week ended February 9, down 0.3 million bpd
from the prior week
-
Rig Count
- The total number of oil rigs amounted to 621, down 2 from last week
-
Inventories
-
Crude Oil
- Total U.S. crude oil inventories now amount to 439.5 million barrels, down (6.8%) YoY
- Refiners operated at a capacity utilization rate of 80.6% for the week, down from 82.4% in the prior week
- U.S. crude oil imports now amount to 6.907 million barrels per day, down (3.8%) YoY
-
Gasoline
- Retail average regular gasoline prices amounted to $3.28 per gallon in the week of February 16,
down (4.0%) YoY
- Gasoline prices on the East Coast amounted to $3.26, down (5.2%) YoY
- Gasoline prices in the Midwest amounted to $3.12, down (5.7%) YoY
- Gasoline prices on the Gulf Coast amounted to $2.91, down (6.5%) YoY
- Gasoline prices in the Rocky Mountain region amounted to $2.91, down (25.2%) YoY
- Gasoline prices on the West Coast amounted to $4.15, down (2.0%) YoY
- Motor gasoline inventories were down by 3.7 million barrels from the prior week
- Motor gasoline inventories amounted to 247.3 million barrels, up 2.2% YoY
- Production of motor gasoline averaged 9.18 million bpd, up 0.9% YoY
- Demand for motor gasoline amounted to 8.168 million bpd, down (1.3%) YoY
-
Distillates
- Distillate inventories decreased by -1.9 million in the week of February 16
- Total distillate inventories amounted to 125.7 million barrels, up 5.4% YoY
- Distillate production averaged 4.076 million bpd, down (9.6%) YoY
- Demand for distillates averaged 3.514 million bpd in the week, down (9.8%) YoY
-
Natural Gas
- Natural gas inventories decreased by 49 billion cubic feet last week
- Total natural gas inventories now amount to 2,535 billion cubic feet, up 11.9% YoY
Credit News
High yield bond yields increased 7bps to 7.82% and spreads decreased 2bps to 347bps. Leveraged loan yields increased 14bps to 9.42% and spreads decreased 1bps to 526bps. WTD Leveraged loan returns were positive 19bps. WTD high yield bond returns were negative 12bps. For the week, credit markets reacted in a mixed manner to stronger than expected CPI and PPI data. Floating rate loans outperformed fixed coupon bonds. 10yr treasury yields were 11bps higher on week.
High-yield:
Week ended 02/16/2024
- Yields & Spreads1
- Pricing & Returns1
- Fund Flows2
- New Issue2
- Distressed Level (trading in excess of 1,000 bps)2
- Total HY Defaults
1 Source: Credit Suisse High Yield and Leveraged Loan Index
2 Source: JP Morgan
Leveraged loans:
Week ended 02/16/2024
- Yields & Spreads1
- Leveraged Loan Index1
- Fund Flows2
- New Issue2
- Distressed Level (loan price below $80)1
- Total Loan Defaults
Default activity:
- Most recent defaults include: Enviva Partners ($750mn, 1/15/24, Mobileum ($538mm, 12/1/23) Ligado Networks ($4.2bn, 11/1/23), Air Methods ($1.7bn, 10/24/23), WeWork ($1.6bn, 10/15/23), Rite Aid ($3.0bn 10/16/23)
CLOs:
Week ended 02/16/2024
- New U.S. CLO Issuance2
- New U.S. CLO Issuance2
Note:High-yield and leveraged loan yields and spreads are swap-adjusted
1 Source: Credit Suisse High Yield and Leveraged Loan Index
2 Source: JP Morgan
Ratings activity:
- S&P and Moody’s High Yield Ratings
Appendix:
Diagram A: Leveraged Loan Trading Levels
Source: Credit Suisse Leveraged Loan Index
Diagram B: High Yield and Leveraged Loan LTM Price
Diagram C: Leveraged Loan and High Yield Returns
Diagram J: Leveraged Loan Defaults by Sector – Full Year
Diagram L: CLO Economics
Diagram N: Developed Country GovBond Yields (%)
Diagram O: S&P 500 Historical Multiples
Diagram P: U.S. Middle-Market M&A Valuations (EV/EBITDA)
Diagram Q: U.S. Large Cap M&A Valuations (EV/EBITDA
Diagram R: Dry Powder for All Private Equity Buyouts
Diagram S: Structured Credit Spreads
Diagram T: Structured Credit Yield
Diagram U: CAT Bonds – Cumulative Returns
Diagram V: SOFR CURVE
Freight Rates
Drewry World Container Index
China-Global & Shanghai Export Container Freight Index
