

.png)


Key Takeaways – Risk, Liquidity and the Post-COVID Capability Gap
COVID-era liquidity masked risks that are only now emerging
Low borrowing costs and flexible financing extended borrower runways. Restructurings and PIK arrangements may now defer credit events without resolving underlying stress.
The pandemic dealmaking boom left a lasting liquidity overhang
Roughly 32,000 PE-backed companies remain in portfolios as higher rates and valuation gaps constrain exits and distributions.
The post-COVID reset is widening the capability gap
With easy liquidity and rising valuations gone, restructuring expertise, capital discipline and technology-enabled operations are becoming key differentiators.
The zero-rate, stimulus-driven boom created a private debt market that underwrote for a benign world. Defaults were rare, so many GPs never built real workout and restructuring capabilities. That gap is now being tested across the asset class simultaneously, in a higher-for-longer rate environment.
On the equity side, roughly 32,000 PE-backed companies representing approximately $3.8 trillion in unrealized value are sitting in portfolios longer than usual, distributions to LPs have fallen to levels not seen since 2008–2009, and GPs without capital-preservation resources or real technology and AI enablement risk falling structurally behind, not just underperforming.
Layered on top are persistent inflation, high capital costs, tariffs, and a consumer base stratifying sharply between high- and low-end spending.
Private Credit: Boom, and a Deferred Bust
U.S. direct lending expanded rapidly during the low-rate era, as sponsors and borrowers embraced private solutions for speed and flexibility. But headline default numbers understate the real picture.
Proskauer's Private Credit Default Index, which tracks senior-secured and unitranche loans in the United States, climbed from 1.84% in Q3 2025 to 2.73% in Q1 2026, before easing modestly to 2.51% in Q2 2026. Fitch, using a broader definition that captures distressed exchanges and other credit events, reported a 6.0% U.S. private credit default rate in April 2026.
The measures are not directly comparable because of differences in methodology. That difference is precisely the point. A narrow measure of payment defaults can show a materially different level of stress than one that also captures distressed restructurings and other credit events.
Figure 1: Private Credit Default Rates by Methodology, 2025–2026
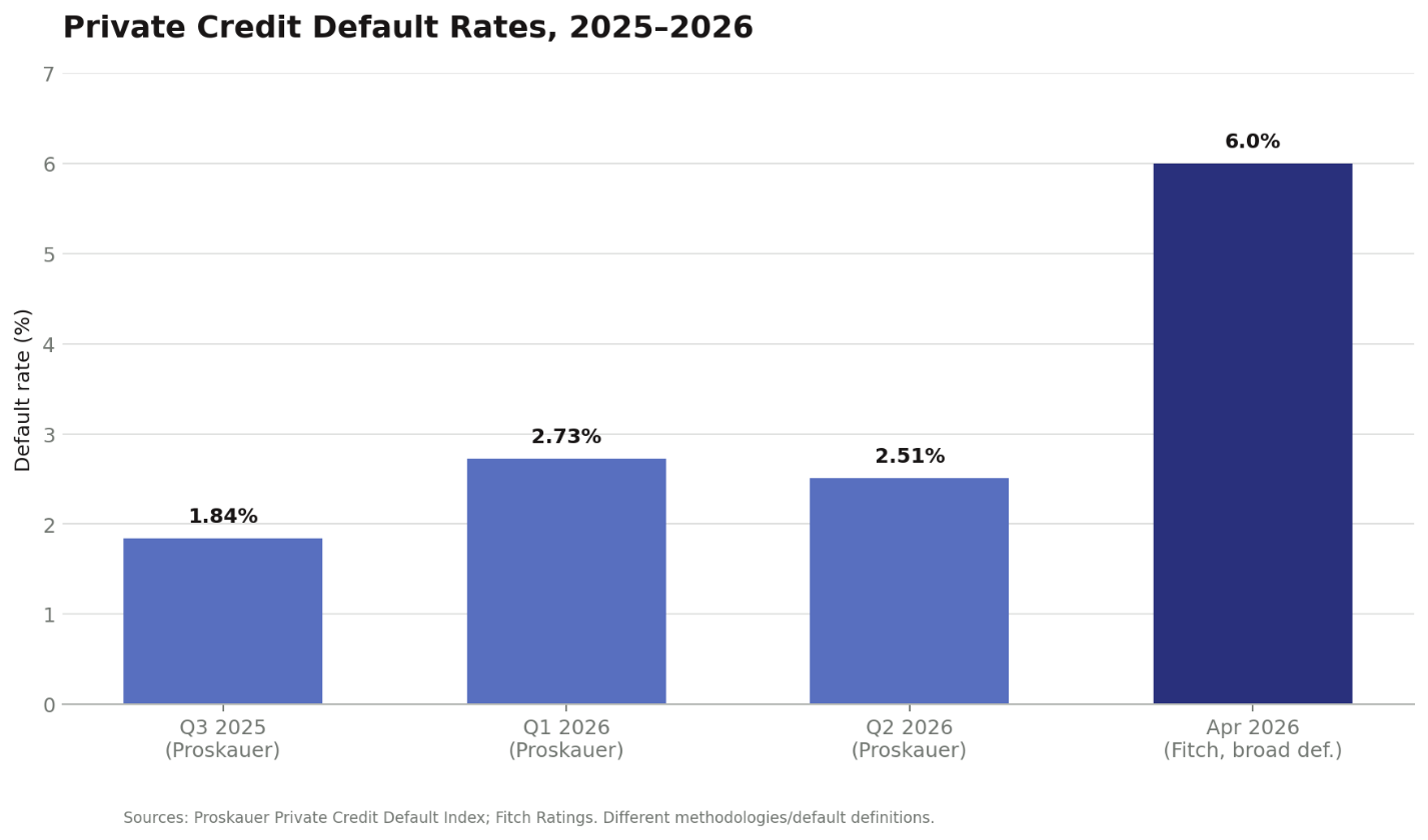
The gap between the two measures is the point. Moody's Ratings data shows that roughly 65% of all corporate defaults in 2025 were distressed restructurings, including workouts, indenture modifications, debt-for-equity swaps, and other credit events that imposed losses on investors, rather than hard payment failures. This raises the question of how much stress has actually been resolved versus simply deferred.
Crucially, these soft restructurings can rely heavily on PIK structures and amend-and-extend terms. Compounding unpaid interest directly into the debt stack increases the terminal debt burden, meaning that if a second-wave default occurs, recovery prospects may deteriorate.
Historical experience reinforces that risk. More than one in three distressed restructurings ultimately ends in either a hard default or another distressed credit event, and more than 70% of eventual hard defaults following a distressed restructuring occur within the first two years. That means borrowers restructured in 2023–2024 are now moving through a particularly important performance window.
PwC's Global Private Credit Survey 2026 frames this directly as a coming differentiator, asking whether managers have invested in workout and restructuring capabilities to manage portfolios through a cycle, and in technology-driven early-warning indicators that can identify downside risk before it fully materializes.
PE's Inventory Problem: 32,000 Unsold Companies
The industry is holding roughly 32,000 unsold portfolio companies worth approximately $3.8 trillion, according to Bain & Company, representing one of the largest exit backlogs in private equity history. Average buyout holding periods at exit have stretched to about seven years, up from five to six years between 2010 and 2021, and roughly 40% of buyout-backed companies are now held longer than five years, versus 29% in 2019.
Distributions have fallen accordingly. Bain's Global Private Equity Report 2026 found that distributions as a share of NAV were approximately 14% in 2025, up from 11% in 2024 according to Bain’s 2025 report, but still at a level not seen since 2008–2009 and well below the average of 29% between 2014 and 2017.
On an AUM basis, McKinsey's Global Private Markets Report 2026 puts distributions at approximately 6% of AUM in the 12 months ended June 2025, against a 16% average from 2015–2019. LPs are therefore receiving materially less realized cash than they did in the late 2010s, while significant capital remains tied up in existing funds.
This DPI bottleneck creates a structural fundraising feedback loop. Reduced distributions constrain LPs' capacity to commit fresh capital to incoming vintages until more principal is returned from existing funds.
Figure 2: PE Distributions as a Percentage of NAV, Global Buyout
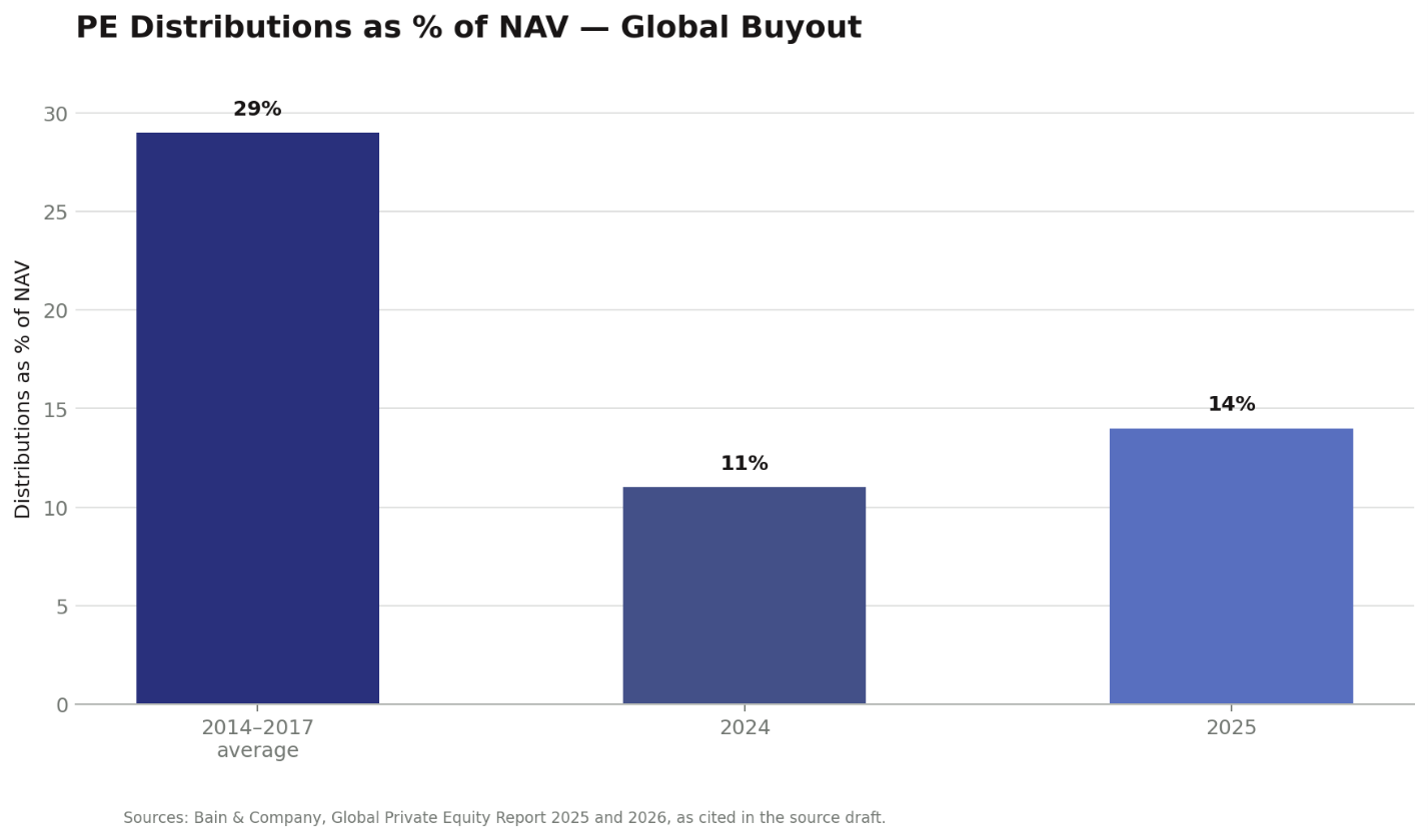
The workaround has increasingly been financial engineering and alternative liquidity structures rather than traditional exits. Continuation vehicles accounted for approximately 19% of sponsor-backed exit volume in H1 2025, while secondaries-focused funds had approximately $255 billion of capital available to deploy at year-end 2024.
Pricing has also strengthened, with buyout LP interests trading at approximately 94% of NAV in H1 2025, reflecting significant demand for high-quality secondary assets.
NAV facilities are evolving as well. Follow-on investments are now the most commonly cited use of proceeds for primary NAV facilities, accounting for approximately 45% of reported facilities.
That distinction is worth noting because NAV-loan-funded distributions can increase reported DPI without an underlying asset realization and, all things being equal, reduce net fund performance because the facility's cost of capital is ultimately borne by investors.
The Bifurcation: Workout & Tech Capability as the New Moat
Manager dispersion is widening sharply. The spread between top- and bottom-quartile buyout returns for the 2021 vintage is nearly 14 percentage points, the widest since 2014, underscoring the growing importance of manager selection.
At the same time, realized distributions are becoming increasingly important to LP allocation decisions. McKinsey's 2026 survey of 300 leading LPs found that DPI is now tied with MOIC as the second-most-important metric shaping allocation decisions, behind IRR.
GPs are responding by building more systematic, exit-committee-driven processes to realize value rather than simply mark it.
Technology and AI enablement are becoming inseparable from this capability gap. Firms deploying AI within portfolio companies to drive measurable margin improvement are increasingly focused on translating technology investment into tangible operating results.
In practice, AI implementation must move beyond broad operational efficiency and directly target EBITDA defense, margin improvement, cash generation, and debt-service capacity.
The practical read: GPs without workout and restructuring capabilities, and without a real operational technology toolkit, are compounding both risks at once. They can neither defend capital as effectively in a downturn nor demonstrate the margin improvement LPs and lenders increasingly expect before committing further capital.
Macro Overlay
High capital costs: PIK usage remains elevated at BDCs, at approximately 8% of interest income, as a way to defer cash stress rather than resolve it, potentially compounding refinancing risk as legacy restructurings move through their most vulnerable window.
Tariffs and consumer stratification: Portfolio companies face margin pressure from both directions, with revenue mix increasingly shaped by a bifurcated high- and low-end consumer while input and financing costs remain elevated by tariffs and rates simultaneously.
Inflation: Persistent inflation keeps real capital costs elevated, extending the window in which workout and technology capability gaps matter most.
Bottom Line
Two asset classes, one underlying mechanism.
In private credit, stress is being deferred through soft workouts rather than fully resolved. In PE, liquidity is being deferred through longer holds and continuation vehicles rather than traditional exits.
In both cases, GPs lacking workout capability, capital-preservation discipline, and genuine technology and AI enablement risk pushing problems forward rather than solving them. Widening manager dispersion suggests that the market is increasingly differentiating between managers equipped to navigate these challenges and those that are not.
Sources
Bain & Company. Global Private Equity Report 2025. 2025.
Bain & Company. Global Private Equity Report 2026. 2026.
Fitch Ratings. U.S. Private Credit Default Data. April 2026.
Institutional Limited Partners Association (ILPA). NAV-Based Facilities: Guidance for LPs and GPs. July 2024.
Jefferies. Global Secondary Market Review. July 2025.
J.P. Morgan Asset Management. Guide to Alternatives. Q3 2025.
McKinsey & Company. Global Private Markets Report 2026. 2026.
Moody’s Ratings. Lend, Extend, and Then...: What Historical Data on Distressed Restructurings Tell Us About the Direction of Credit Risk. May 18, 2026.
PitchBook LCD. BDC PIK Income Analysis. June 2026.
Proskauer Rose LLP. Private Credit Default Index. Q3 2025, Q1 2026 and Q2 2026.
Proskauer Rose LLP. Insights on the NAV Financing Market. Full Year 2025.
PwC. Global Private Credit Survey 2026. 2026.
Stout. Alternative Liquidity: GP-Led Secondaries & Dividends Lead in 2025. 2025.
About
ZCG
ZCG is a leading, privately held global firm comprised of private markets asset management, business consulting services, and technology development and solutions.
ZCG’s investors are some of the largest and most sophisticated global institutional investors including pension funds, endowments, foundations, sovereign wealth funds, central banks, and insurance companies.
For almost 30 years, ZCG Principals have invested tens of billions of dollars of capital. ZCG has a global team comprised of approximately 250 professionals. ZCG is headquartered in New York, with eight affiliated offices, across six countries. For more information on ZCG, please visit www.zcg.com.
You can also learn more about ZCGC, the business consulting services platform of ZCG, at www.zcgc.com, and explore ZCG’s technology affiliate, Haptiq, at www.haptiq.com.